Australian Dollar struggles to rebound as US-China trade dispute intensifies
- The Australian Dollar faces headwinds as the White House confirmed that US tariffs on Chinese goods have climbed to 145%.
- China retaliated by lifting additional tariffs on US imports to 125% from 84%.
- The US Dollar remains under heavy pressure, weighed down by ongoing concerns about global and domestic economic outlooks.
The Australian Dollar (AUD) struggles to find demand on Friday. The AUD/USD fails to capitalize on the broad-based selling pressure surrounding the US Dollar (USD) and fluctuates above 0.6220. T
The White House confirmed that the cumulative US tariffs on Chinese goods have risen to 145%. The announcement heightened tensions in the ongoing trade dispute between the world’s two largest economies, raising concerns for Australia given its strong trade ties with China.
In response, China's Finance Ministry announced on Friday that they will raise additional tariffs on US imports from 84% to 125% from April 12.
The AUD found support on Thursday from reports that Australia is preparing to resume trade negotiations with the European Union (EU). Moreover, the Wall Street Journal reported that China also held talks with EU trade chief Maros Sefcovic, expressing interest in strengthening trade, investment, and industrial cooperation with the bloc.
Australian Dollar stays on the back foot on risk-aversion
- The US Dollar Index (DXY), which measures the US Dollar against a basket of six major currencies, is trading at its lowest level in three yeras below 99.50. The DXY continues to slide amid persistent concerns surrounding both the global and US economic outlooks. Investors are now turning their attention to the upcoming release of the US March Producer Price Index (PPI) and the preliminary Michigan Consumer Sentiment data, both due later on Friday.
- The US Consumer Price Index (CPI) inflation eased to 2.4% year-over-year in March, down from 2.8% in February and below the market forecast of 2.6%. Core CPI, which excludes food and energy prices, rose 2.8% annually, compared to 3.1% previously and missing the 3.0% estimate. On a monthly basis, headline CPI dipped by 0.1%, while core CPI edged up by 0.1%.
- In a move aimed at easing trade tensions, President Trump on Wednesday announced a 90-day pause on new tariffs for most US trade partners, lowering rates to 10% to create space for continued negotiations. “The 90-day pause is an encouraging sign that negotiations with most countries have been productive,” said Mark Hackett of Nationwide. “It also injects some much-needed stability into a market rattled by uncertainty.”
- Minutes from the latest Federal Open Market Committee (FOMC) Meeting suggested that policymakers are nearly unanimous in recognizing the dual challenge of rising inflation and slowing growth, cautioning that the Federal Reserve faces “difficult tradeoffs” in the months ahead.
- China’s CPI declined 0.1% year-over-year in March, following a 0.7% drop in February and falling short of expectations for a 0.1% increase. Monthly, CPI dropped 0.4%, worse than the previous month’s 0.2% decline and the forecasted figure. China’s PPI also contracted more sharply than expected, falling 2.5% annually in March versus a 2.2% drop in February and a projected 2.3% decline.
- In Australia, subdued business and consumer sentiment has strengthened expectations of a dovish tilt from the Reserve Bank of Australia (RBA). Markets are now pricing in up to 100 basis points in rate cuts this year, beginning in May, with additional reductions likely in July and August.
US-China Trade War FAQs
Generally speaking, a trade war is an economic conflict between two or more countries due to extreme protectionism on one end. It implies the creation of trade barriers, such as tariffs, which result in counter-barriers, escalating import costs, and hence the cost of living.
An economic conflict between the United States (US) and China began early in 2018, when President Donald Trump set trade barriers on China, claiming unfair commercial practices and intellectual property theft from the Asian giant. China took retaliatory action, imposing tariffs on multiple US goods, such as automobiles and soybeans. Tensions escalated until the two countries signed the US-China Phase One trade deal in January 2020. The agreement required structural reforms and other changes to China’s economic and trade regime and pretended to restore stability and trust between the two nations. However, the Coronavirus pandemic took the focus out of the conflict. Yet, it is worth mentioning that President Joe Biden, who took office after Trump, kept tariffs in place and even added some additional levies.
The return of Donald Trump to the White House as the 47th US President has sparked a fresh wave of tensions between the two countries. During the 2024 election campaign, Trump pledged to impose 60% tariffs on China once he returned to office, which he did on January 20, 2025. With Trump back, the US-China trade war is meant to resume where it was left, with tit-for-tat policies affecting the global economic landscape amid disruptions in global supply chains, resulting in a reduction in spending, particularly investment, and directly feeding into the Consumer Price Index inflation.
Australian Dollar holds slightly above 0.6200
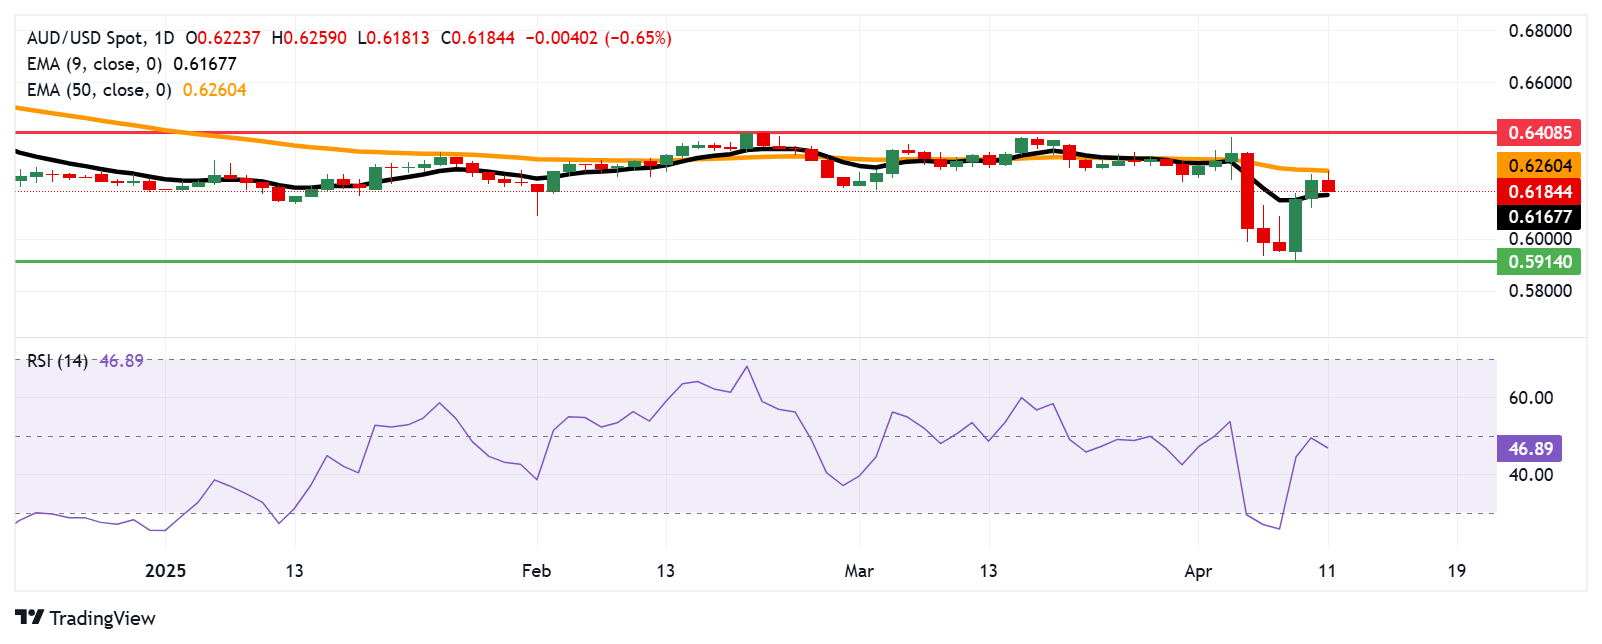
The AUD/USD pair's daily chart indicators show a slight bullish tilt as the pair trades above the nine-day Exponential Moving Average (EMA). However, the 14-day Relative Strength Index (RSI) remains just below the 50 mark, indicating that bearish pressure hasn’t fully faded.
Immediate support is seen at the nine-day EMA, currently at 0.6167. A decisive break below this level could undermine short-term bullish momentum and open the door for a move toward the 0.5914 zone—its lowest point since March 2020—followed by the key psychological support at 0.5900.
To the upside, initial resistance is located at the 50-day EMA, around 0.6260. A sustained move above this level could pave the way for a stronger recovery, potentially pushing the AUD/USD pair toward the four-month high of 0.6408.
AUD/USD: Daily Chart
Australian Dollar PRICE Today
The table below shows the percentage change of Australian Dollar (AUD) against listed major currencies today. Australian Dollar was the weakest against the Euro.
| USD | EUR | GBP | JPY | CAD | AUD | NZD | CHF | |
|---|---|---|---|---|---|---|---|---|
| USD | -0.91% | -0.31% | -0.86% | -0.06% | 0.66% | -0.38% | -0.47% | |
| EUR | 0.91% | 0.58% | 0.02% | 0.83% | 1.57% | 0.50% | 0.41% | |
| GBP | 0.31% | -0.58% | -0.54% | 0.25% | 0.99% | -0.09% | -0.16% | |
| JPY | 0.86% | -0.02% | 0.54% | 0.79% | 1.56% | 0.55% | 0.47% | |
| CAD | 0.06% | -0.83% | -0.25% | -0.79% | 0.72% | -0.31% | -0.41% | |
| AUD | -0.66% | -1.57% | -0.99% | -1.56% | -0.72% | -1.05% | -1.13% | |
| NZD | 0.38% | -0.50% | 0.09% | -0.55% | 0.31% | 1.05% | -0.08% | |
| CHF | 0.47% | -0.41% | 0.16% | -0.47% | 0.41% | 1.13% | 0.08% |
The heat map shows percentage changes of major currencies against each other. The base currency is picked from the left column, while the quote currency is picked from the top row. For example, if you pick the Australian Dollar from the left column and move along the horizontal line to the US Dollar, the percentage change displayed in the box will represent AUD (base)/USD (quote).
 Copy Link
 Share on Facebook
 Share on X
 Share by Email