
Gold Technical Analysis – We are back at a key resistance
Fundamental Overview
Gold eventually extended the gains in the past couple of days supported by lower real yields and US dollar. There was no fresh catalyst for the moves as the market has been likely driven by repositioning after the lower than expected US inflation data last week.
In the bigger picture, gold should remain in an uptrend as real yields will likely continue to fall amid Fed easing. But further hawkish repricing in interest rates expectations could trigger corrections in the short term.
Gold Technical Analysis – Daily Timeframe
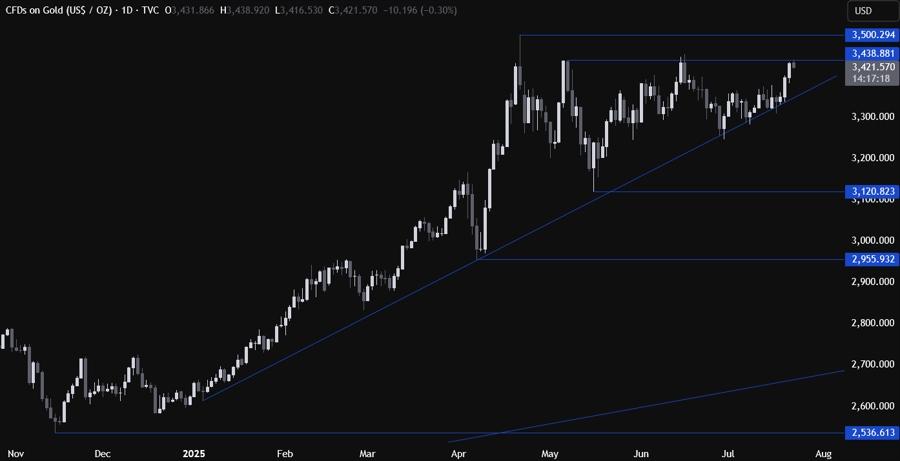
On the daily chart, we can see that gold eventually extended the gains into the 3438 resistance as buyers kept the bullish momentum going. This is where we can expect the sellers to step in with a defined risk above the resistance to position for a drop back into the major trendline. The buyers, on the other hand, will look for a breakout to increase the bullish bets into a new all-time high.
Gold Technical Analysis – 4 hour Timeframe
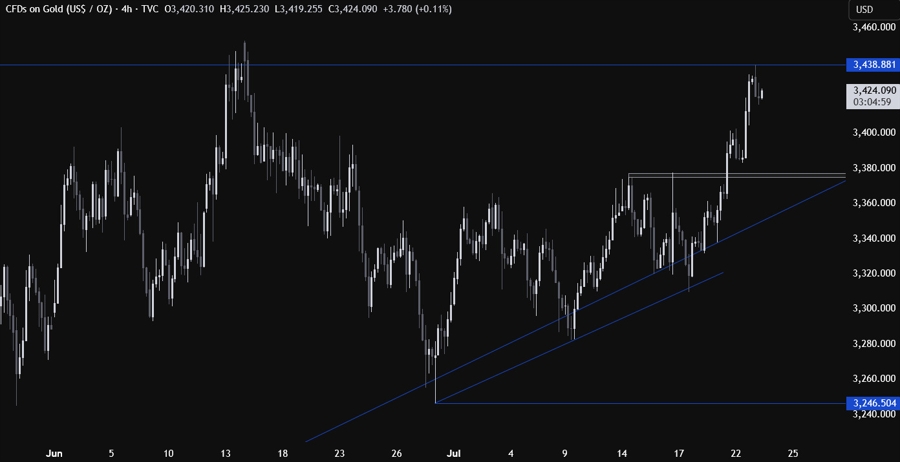
On the 4 hour chart, we can see that after breaking above the minor resistance zone around the 3377 level, the buyers increased the bullish bets and extended the gains into the 3438 level. Again, we can expect the sellers to step in around these levels to position for a pullback into the major trendline, while the buyers will target a breakout and extend the rally further.
Gold Technical Analysis – 1 hour Timeframe
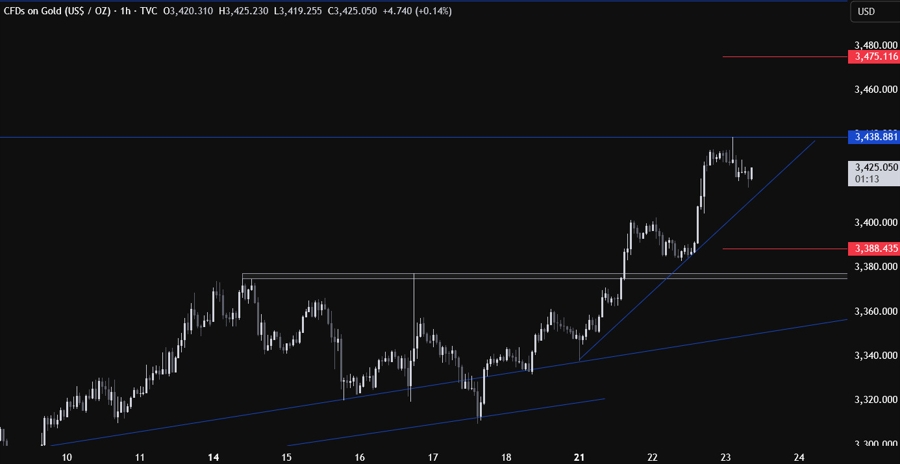
On the 1 hour chart, we can see that we have a minor upward trendline defining the bullish momentum on this timeframe. The buyers will likely continue to lean on it to keep pushing into new highs, while the sellers will look for a break lower to increase the bearish bets into the major trendline. The red lines define the average daily range for today.
Upcoming Catalysts
Tomorrow we get the latest US Jobless Claims figures and the flash US PMIs.
 Copy Link
 Share on Facebook
 Share on X
 Share by Email
