US GDP set to show economy slowed sharply in Q1 amid impact from tariff policy
- The United States Gross Domestic Product is seen expanding at an annualised rate of 0.4% in Q1.
- Investors will focus on the potential impact of tariffs on the economy.
- The US Dollar looks consolidative in the lower end of its yearly range.
The United States (US) Bureau of Economic Analysis (BEA) is set to publish its preliminary estimate of first-quarter Gross Domestic Product (GDP) on Wednesday, with analysts expecting the data to show annualized growth of just 0.4%, a sharp slowdown from the 2.4% pace recorded in the final quarter of 2024.
Markets brace for key US growth data amid tariff jitters, inflation concerns
Markets are on edge ahead of Wednesday’s release of the US preliminary GDP figures for the first quarter—widely considered the most market-moving estimate of the three issued each quarter. Beyond headline growth, the report also includes fresh Personal Consumption Expenditures (PCE) data, the Federal Reserve’s (Fed) preferred inflation gauge.
This quarter’s numbers carry particular weight, as investors look for early signs of the economic fallout from President Donald Trump’s newly imposed tariffs. With both output and domestic prices in focus, the data could offer crucial clues about the broader macroeconomic impact of the administration’s trade policies.
The release follows the Fed’s March 18-19 meeting, where policymakers delivered a mixed outlook in their latest Summary of Economic Projections (SEP), commonly referred to as the “dot plot.” Officials marked down growth expectations for 2025, even as they penciled in slightly stronger PCE inflation. The revisions reflect growing uncertainty within the central bank over the balance of risks to the US economy.
Also included in the report is the GDP Price Index – commonly called the GDP deflator – which measures inflation across all domestically produced goods and services, including exports but excluding imports. It’s expected to rise to 3.1% for the first quarter, up from 2.3% in the final months of 2024, offering further insight into how inflation is weighing on real output.
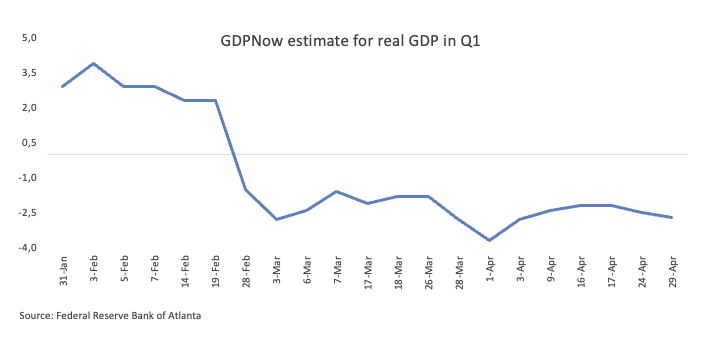
Adding to the caution, the Atlanta Fed’s GDPNow model – closely watched for its real-time tracking of economic activity – forecasted a sharp 2.7% contraction in Q1 GDP as of its April 27 update.
When will the GDP print be released and how can it affect the US Dollar Index?
The US GDP report, due at 12:30 GMT on Wednesday, could prove pivotal for the US Dollar as investors weigh the strength of the economy against persistent inflation pressures and the spectre of tariffs. Alongside the headline growth figure, markets will scrutinize updates to the GDP Price Index and the Q1 Personal Consumption Expenditures (PCE) Price Index, key data points that could shift expectations for Federal Reserve policy and the Dollar’s direction.
A stronger-than-expected GDP print may temporarily ease fears of a stagflationary environment, potentially offering a brief reprieve for the struggling Greenback.
However, the broader technical outlook for the US Dollar Index (DXY) remains decisively bearish. The index continues to trade beneath its 200-day and 200-week simple moving averages (SMAs), now positioned at 104.48 and 102.70, respectively.
Downside levels remain in focus, with support eyed at 97.92 – the 2025 low marked on April 21 – and 97.68, a key pivot from March 2022. Any upside correction could first target the psychologically significant 100.00 handle, followed by the interim 55-day SMA at 103.64 and the March 26 swing high of 104.68.
Momentum indicators underscore the bearish trend. The Relative Strength Index (RSI) on the daily chart has slipped to around 36, while the Average Directional Index (ADX) has climbed above 55, suggesting growing strength behind the recent downward move.
Economic Indicator
Core Personal Consumption Expenditures - Price Index (MoM)
The Core Personal Consumption Expenditures (PCE), released by the US Bureau of Economic Analysis on a monthly basis, measures the changes in the prices of goods and services purchased by consumers in the United States (US). The PCE Price Index is also the Federal Reserve’s (Fed) preferred gauge of inflation. The MoM figure compares the prices of goods in the reference month to the previous month.The core reading excludes the so-called more volatile food and energy components to give a more accurate measurement of price pressures. Generally, a high reading is bullish for the US Dollar (USD), while a low reading is bearish.
Read more.Last release: Fri Mar 28, 2025 12:30
Frequency: Monthly
Actual: 0.4%
Consensus: 0.3%
Previous: 0.3%
Source: US Bureau of Economic Analysis
After publishing the GDP report, the US Bureau of Economic Analysis releases the Personal Consumption Expenditures (PCE) Price Index data alongside the monthly changes in Personal Spending and Personal Income. FOMC policymakers use the annual Core PCE Price Index, which excludes volatile food and energy prices, as their primary gauge of inflation. A stronger-than-expected reading could help the USD outperform its rivals as it would hint at a possible hawkish shift in the Fed’s forward guidance and vice versa.
Economic Indicator
Gross Domestic Product Price Index
The Gross Domestic Product (GDP) Price Index, released quarterly by the Bureau of Economic Analysis, measures the change in the prices of goods and services produced in the United States. The prices that Americans pay for imports aren’t included. Changes in the GDP price index are followed as an indicator of inflationary pressures, which may anticipate higher interest rates. A high reading is seen as bullish for the US Dollar (USD), while a low reading is seen as bearish.
Read more.Last release: Thu Mar 27, 2025 12:30
Frequency: Quarterly
Actual: 2.3%
Consensus: 2.4%
Previous: 2.4%
Source: US Bureau of Economic Analysis
 Copy Link
 Share on Facebook
 Share on X
 Share by Email