
US Dollar ekes out more losses with Europe united on Ukraine
- The US Dollar dives on Monday with European leaders willing to guarantee a peace deal in Ukraine.
- US manufacturing data with the ISM and S&P Global PMI did not move the needle much.
- The US Dollar Index (DXY) sees Friday's gains evaporate and sprint back lower.
The US Dollar Index (DXY), which tracks the performance of the US Dollar (USD) against six major currencies, breaks below 107.00 and heads to 106.60 at the time of writing on Monday. Market mood improved after European leaders, including Ukrainian President Volodymyr Zelenskyy, showed a willingness to guarantee a peace deal in Ukraine on Sunday. The plan now needs to be backed by the United States (US).
On the economic data front, the focus was on the manufacturing sector in the United States. In addition to the S&P Global Purchase Managers Index (PMI) final reading for February, the Institute for Supply Management (ISM) released its specific manufacturing PMI report. No big changes to report with the DXY heading lower on the back of it.
Daily digest market movers: All mixed
- S&P Global released its Manufacturing PMI final reading for February. A stronger 52.7 came in above 51.6 estimate, from the preliminary reading.
- The ISM has released its report on the Manufacturing sector for February.
- The headline PMI came in softer at 50.3, missing the 50.5 estimate and compared to 50.9 in January.
- The Prices Paid subindex surged to 62.4, beating the 56.2 estimate, coming from 54.9 in January.
- The New Orders component fell to48.6, coming from 55.1 in the January reading.
- Equities are getting mixed with minor gains or losses on the three major US indices.
- The CME Fedwatch Tool projects a 25.4% chance that interest rates will remain at the current range of 4.25%-4.50% in June, with the rest showing a possible rate cut.
- The US 10-year yield trades around 4.20%, further down from last week’s high of 4.574%.
US Dollar Index Technical Analysis: Back to square one
This week could not start with more uncertainty, with many moving parts and ties still loose since Friday’s burst out at the Oval Office. It becomes relatively clear that US data will be seen as being on auto-pilot, while geopolitics will be the main drivers going deeper into 2025. Traders will need to embrace the new regime where one headline could easily snap a nice continuum or trend in any asset, as well as for the US Dollar Index.
On the upside, the 55-day Simple Moving Average (SMA) is the first resistance to watch for any rejection, currently at 107.98. In case the DXY can break above the 108.00 round level, 108.50 is coming back in scope.
On the downside, the 107.00 round level needs to hold as support. Nearby, 106.84 (100-day SMA) and 106.52, as a pivotal level, should act as support and avoid any returns to the lower 106-region.
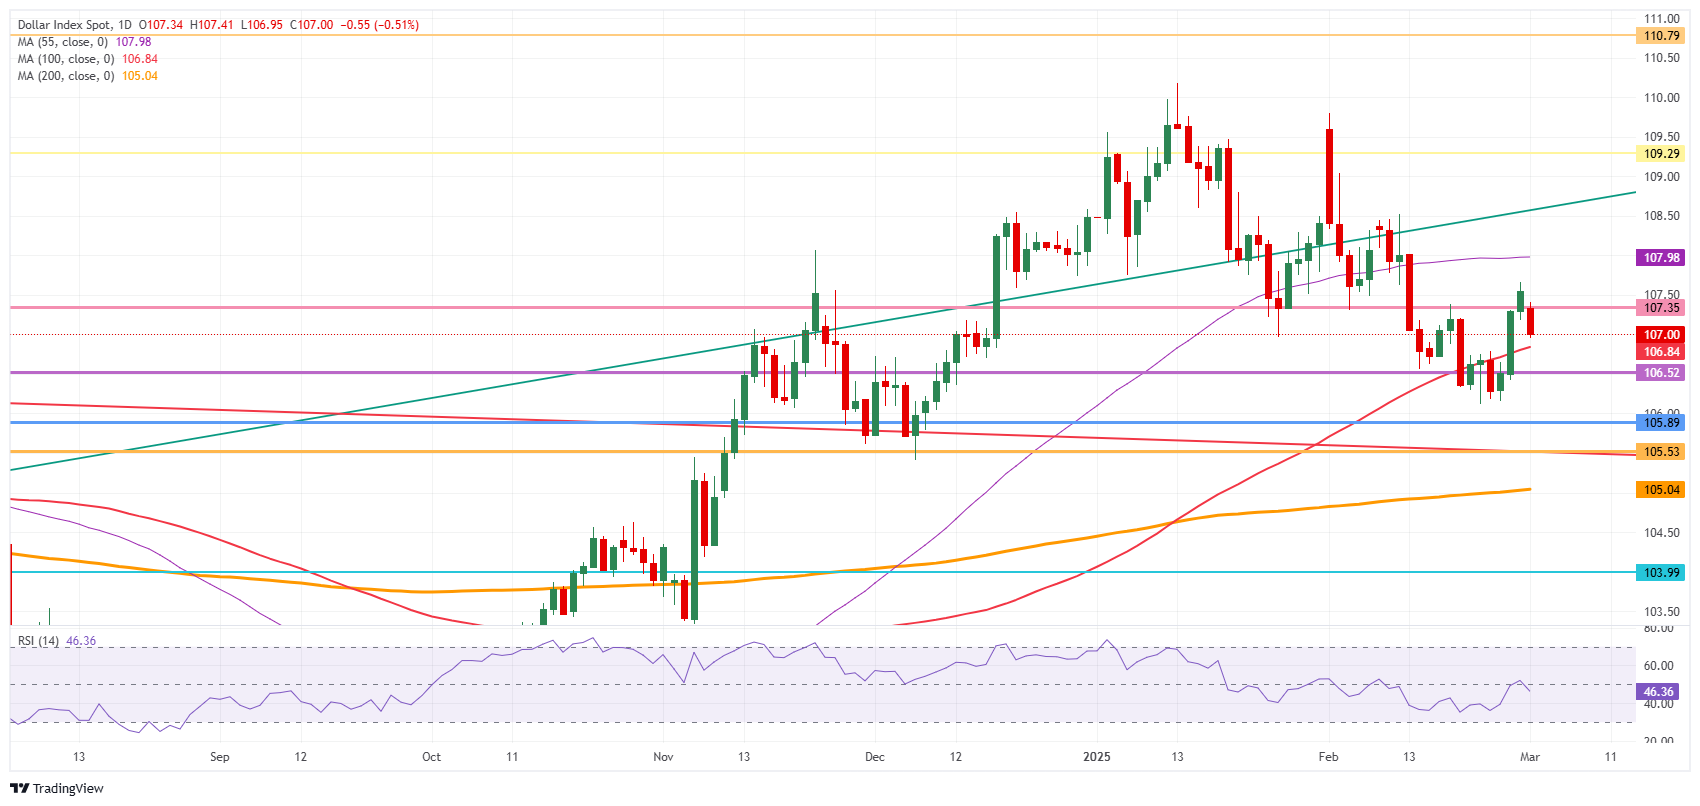
US Dollar Index: Daily Chart
Interest rates FAQs
Interest rates are charged by financial institutions on loans to borrowers and are paid as interest to savers and depositors. They are influenced by base lending rates, which are set by central banks in response to changes in the economy. Central banks normally have a mandate to ensure price stability, which in most cases means targeting a core inflation rate of around 2%. If inflation falls below target the central bank may cut base lending rates, with a view to stimulating lending and boosting the economy. If inflation rises substantially above 2% it normally results in the central bank raising base lending rates in an attempt to lower inflation.
Higher interest rates generally help strengthen a country’s currency as they make it a more attractive place for global investors to park their money.
Higher interest rates overall weigh on the price of Gold because they increase the opportunity cost of holding Gold instead of investing in an interest-bearing asset or placing cash in the bank. If interest rates are high that usually pushes up the price of the US Dollar (USD), and since Gold is priced in Dollars, this has the effect of lowering the price of Gold.
The Fed funds rate is the overnight rate at which US banks lend to each other. It is the oft-quoted headline rate set by the Federal Reserve at its FOMC meetings. It is set as a range, for example 4.75%-5.00%, though the upper limit (in that case 5.00%) is the quoted figure. Market expectations for future Fed funds rate are tracked by the CME FedWatch tool, which shapes how many financial markets behave in anticipation of future Federal Reserve monetary policy decisions.
 Copy Link
 Share on Facebook
 Share on X
 Share by Email
