
Dow Jones Industrial Average sheds 160 points after Retail Sales misfire
- The Dow Jones index remained stuck below 44,750 on Friday.
- Retail Sales missed forecasts, prompting investor caution.
- The Dow is still poised to end the week in the green, but headwinds are building.
The Dow Jones Industrial Average (DJIA) cooled on Friday, shedding around 160 points and waffling into the 44,600 region after US Retail Sales missed the mark in January. US data broadly came in below previous figures, except for the Export Price Index, which accelerated at its fastest pace in nearly three years.
US Retail Sales came in well below expectations in January, contracting by 0.9% versus the forecast of -0.1%. The previous month’s print was revised higher to 0.7%, but the steep dropoff knocked investor confidence for a loop early during the US market session. Core Retail Sales fared better but still fell to -0.4% against the 0.3% forecast and 0.7% last post-revision.
January’s Export Price Index rose to a 32-month high of 1.3%, well above the 0.3% forecast and 0.5% last. Industrial Production beat forecasts, coming in at 0.5% versus the expected 0.3%, but the figure still fell short of the previous revised print of 1.0%.
Markets will get an extended weekend with the President’s Day holiday set for Monday. The key prints next week will be the Federal Reserve’s (Fed) latest Meeting Minutes, due to release on Wednesday, with Purchasing Managers Index (PMI) survey results slated for next Friday.
Dow Jones news
Roughly two-thirds of the Dow Jones equity board is tilted into the bearish side on Friday after Retail Sales came in much lower than expected. Key energy and banking giants are propping up the bullish side of the equity index, but concentrated losses at the bottom end are dragging the Dow Jones lower. Chevron (CVX) and Goldman Sachs (GS) both rose around 1.6%, hitting $660 and $156 per share, respectively. Procter & Gamble (PG) fell 3.4% to $165 per share after the conglomerate noted that “recent volatility” is crimping its food sales growth expectations for the upcoming year.
Dow Jones price forecast
The Dow Jones is grinding its way into a consolidation pattern between 45,000 and 44,000. The major equity index has been cycling between the two price levels since rising into the region in mid-January, and price action is getting boxed in by a technical ceiling at record highs near 45,070, a level the Dow hasn’t been able to recover since last November.
Bearish momentum still remains limited, and a dip back to the 50-day Exponential Moving Average (EMA) will present a tempting jump-in point for bulls looking to reload on long positions.
Dow Jones daily chart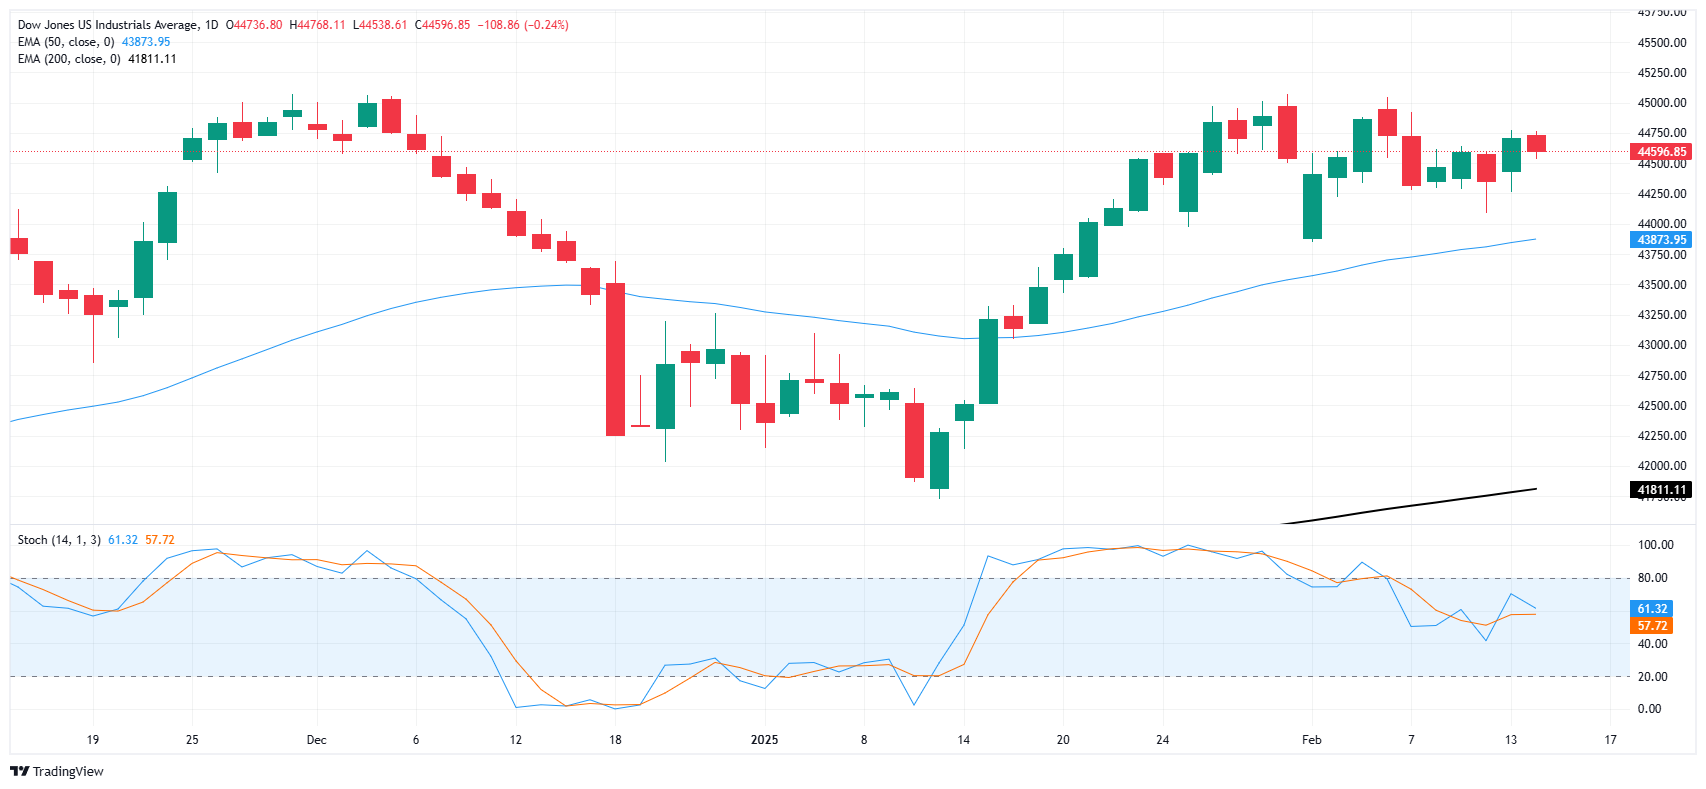
Dow Jones FAQs
The Dow Jones Industrial Average, one of the oldest stock market indices in the world, is compiled of the 30 most traded stocks in the US. The index is price-weighted rather than weighted by capitalization. It is calculated by summing the prices of the constituent stocks and dividing them by a factor, currently 0.152. The index was founded by Charles Dow, who also founded the Wall Street Journal. In later years it has been criticized for not being broadly representative enough because it only tracks 30 conglomerates, unlike broader indices such as the S&P 500.
Many different factors drive the Dow Jones Industrial Average (DJIA). The aggregate performance of the component companies revealed in quarterly company earnings reports is the main one. US and global macroeconomic data also contributes as it impacts on investor sentiment. The level of interest rates, set by the Federal Reserve (Fed), also influences the DJIA as it affects the cost of credit, on which many corporations are heavily reliant. Therefore, inflation can be a major driver as well as other metrics which impact the Fed decisions.
Dow Theory is a method for identifying the primary trend of the stock market developed by Charles Dow. A key step is to compare the direction of the Dow Jones Industrial Average (DJIA) and the Dow Jones Transportation Average (DJTA) and only follow trends where both are moving in the same direction. Volume is a confirmatory criteria. The theory uses elements of peak and trough analysis. Dow’s theory posits three trend phases: accumulation, when smart money starts buying or selling; public participation, when the wider public joins in; and distribution, when the smart money exits.
There are a number of ways to trade the DJIA. One is to use ETFs which allow investors to trade the DJIA as a single security, rather than having to buy shares in all 30 constituent companies. A leading example is the SPDR Dow Jones Industrial Average ETF (DIA). DJIA futures contracts enable traders to speculate on the future value of the index and Options provide the right, but not the obligation, to buy or sell the index at a predetermined price in the future. Mutual funds enable investors to buy a share of a diversified portfolio of DJIA stocks thus providing exposure to the overall index.
 Copy Link
 Share on Facebook
 Share on X
 Share by Email
