
Gold Technical Analysis – The only game in town during stagflationary times
Fundamental Overview
After a brief consolidation in the first part of the week, gold eventually broke out into a new all-time high and surged by more than 3% in just a day. The precious metal has been the only game in town recently as the uncertainty and risk off flows haven’t even supported bonds, which generally rise during such times.
But these are not normal times because the market is fearing stagflation, which hasn’t been seen for decades. This is an environment where you have lower growth and higher inflation. Gold thrives during such times. The problem is that “long gold” is now the most crowded trade, and such parabolic rallies can be wiped out fast if conditions change.
In the bigger picture, gold remains in an uptrend as real yields will likely continue to fall as the Fed is not looking to hike anymore. The risks for the upside in the short term include another aggressive stock market selloff, a hawkish Fed or positive news on the tariffs side.
Gold Technical Analysis – Daily Timeframe

On the daily chart, we can see that after a brief consolidation, gold skyrocketed once again into new all-time highs. From a risk management perspective, the buyers will have a better risk to reward setup around the trendline to position for further upside. The sellers, on the other hand, will want to see the price breaking below the trendline and the 2957 level to extend the drop into the 2832 level next.
Gold Technical Analysis – 4 hour Timeframe

On the 4 hour chart, we can see that we have a minor upward trendline defining the bullish momentum on this timeframe. The buyers will likely lean on the trendline to keep pushing into new highs, while the sellers will look for a break lower to extend the pullback into the 3195 level next.
Gold Technical Analysis – 1 hour Timeframe
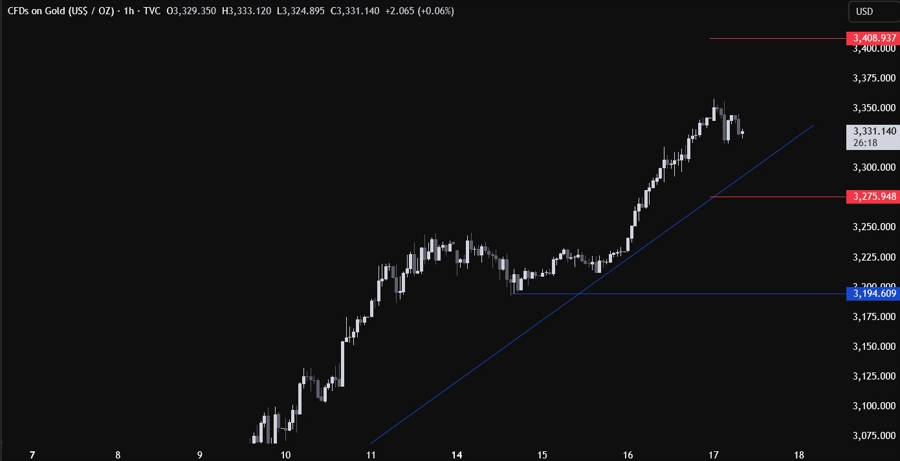
On the 1 hour chart, there’s not much else we can add here as the buyers will look for a bounce around the trendline, while the sellers will look for a break. The red lines define the average daily range for today.
Upcoming Catalysts
Today we get the latest US Jobless Claims figures. But as a reminder, the market is focused on tariff negotiations at the moment, so the data is not as market-moving as it used to be in the past months. So, we will likely need at least a new cycle high in the Jobless Claims data to trigger a notable reaction.
 Copy Link
 Share on Facebook
 Share on X
 Share by Email
