
USDJPY Technical Analysis – Is this a breakout or just a fakeout?
Fundamental Overview
The USD yesterday got a boost across the board following the US CPI report. The data was actually in line with expectations and arguably on the softer side than feared. In fact, the market didn’t really move much following the release but roughly an hour later we started to see strong bids in the greenback.
This might have to do with positioning since the “short US dollar” trade has been the most crowded one and in such instances, it doesn’t take much to see strong unwinding. The market did pare back further the rate cut bets with the pricing now showing 44 bps of easing by year end compared to 47 bps before the CPI release. That could still change today after the US PPI report.
On the JPY side, we haven’t seen much change in terms of fundamentals as the focus remains on the US-Japan trade negotiations. The BoJ is placing a great deal on trade developments and a positive outcome will likely give the JPY a strong boost as traders would bring forward expectations for a rate hike. The window to watch is between July 20 and August 1. On July 20, we have the Japanese upper house elections and August 1 is Trump’s deadline for a deal.
USDJPY Technical Analysis – Daily Timeframe
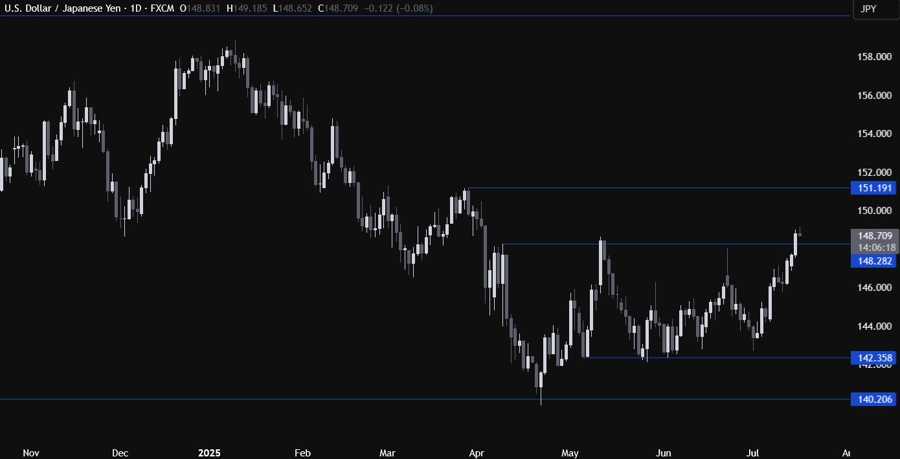
On the daily chart, we can see that USDJPY eventually managed to rally all the way back to the key 148.28 resistance. The price is now trading above the resistance following a strong day for the US dollar yesterday after the US CPI.
If the price falls back below the resistance, we can expect the sellers to pile in to position for a drop back into the 142.35 support. The buyers, on the other hand, will keep on stepping in around these levels to keep pushing into the next resistance at 151.19.
USDJPY Technical Analysis – 4 hour Timeframe
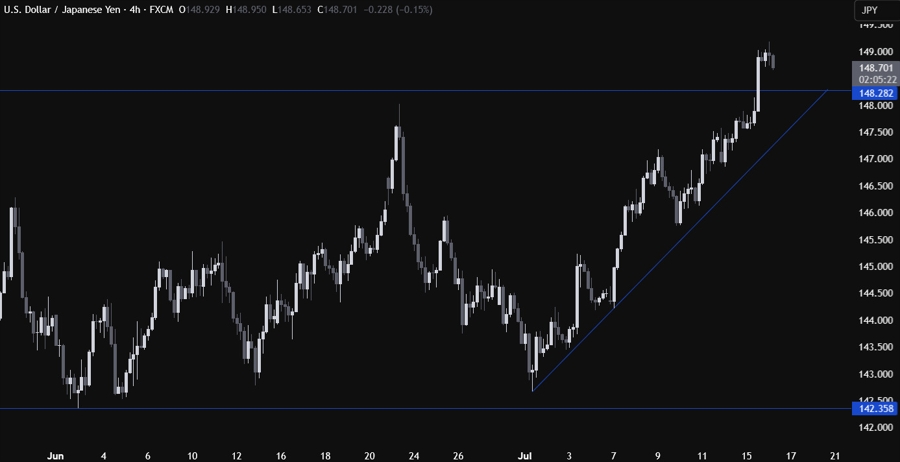
On the 4 hour chart, we can see that we have an upward trendline defining the bullish momentum. From a risk management perspective, the buyers will have a better risk to reward setup around the trendline to position for a rally into the 151.19 level next. The sellers, on the other hand, will look for a break below the trendline to increase the bearish bets into the 142.35 support.
USDJPY Technical Analysis – 1 hour Timeframe
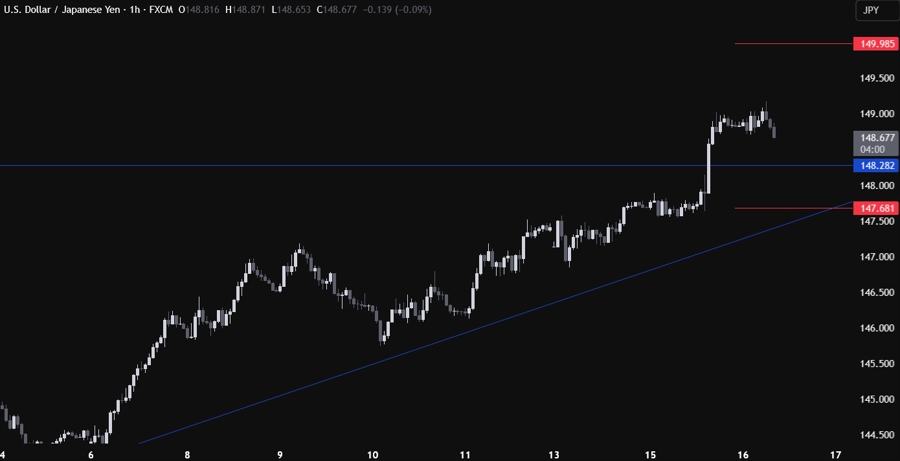
On the 1 hour chart, there’s not much else we can add here as the buyers will look for dip-buying opportunities around the 148.00 handle and the trendline, while the sellers will look for downside breakouts to keep pushing into new lows. The red lines define the average daily range for today.
Upcoming Catalysts
Today we have the US PPI data. Tomorrow, we get the latest US Jobless Claims and Retail Sales figures. On Friday, we conclude the week with the Japanese CPI and the University of Michigan Consumer Sentiment survey.
 Copy Link
 Share on Facebook
 Share on X
 Share by Email
