
Bitcoin Technical Analysis – All eyes on the NFP report now
Fundamental Overview
Bitcoin rallied strongly on Friday as Fed Chair Powell tilted more dovish. Traders firmed up expectations for a rate cut in September which now stands around 84% probability with a total of 54 bps of easing by year-end.
The gains started to fade the following day though and the price continued to fall for several days. There was no clear catalyst for the selloff, so it might be technically driven. Nonetheless, the focus has now shifted to the US NFP report next week which is going to be crucial and will influence greatly interest rates expectations.
Strong data might take the probability for a September cut towards a 50/50 chance but will certainly see a more hawkish repricing further down the curve which could weigh on bitcoin in the short-term.
Soft data, on the other hand, will likely see traders increasing the dovish bets with a third cut by year-end being priced in and likely support the cryptocurrency.
Bitcoin Technical Analysis – Daily Timeframe
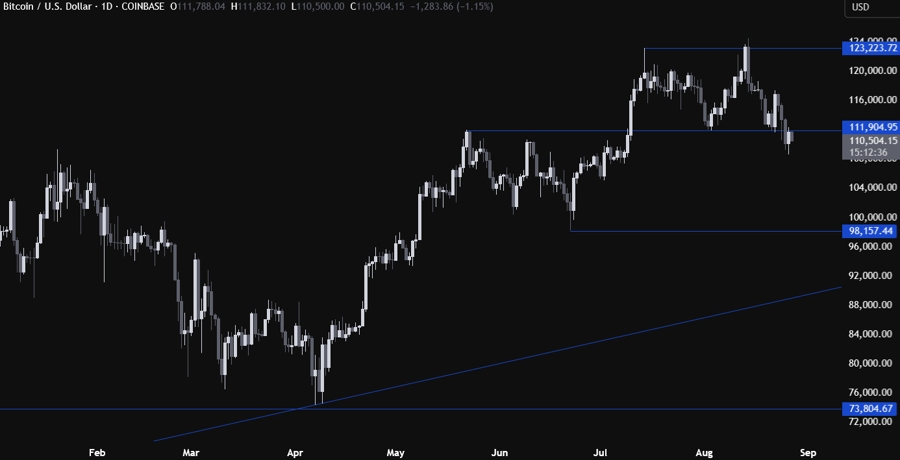
On the daily chart, we can see that Bitcoin is trading below the key support level at 111,900. The sellers will likely continue to pile in around these levels with a defined risk above the 111,900 level to position for a drop into the 100,000 level. The buyers, on the other hand, will want to see the price rising back above the 111,900 level to pile in for a rally into the 123,000 level next.
Bitcoin Technical Analysis – 4 hour Timeframe
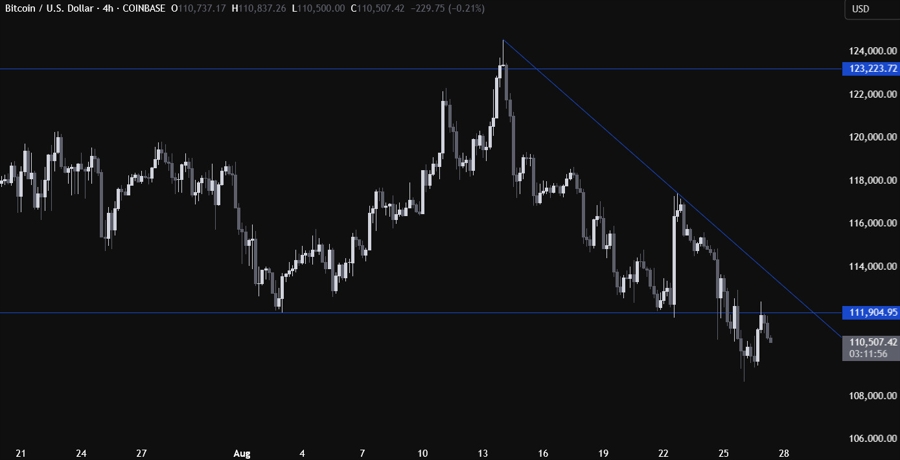
On the 4 hour chart, we can see that we have a downward trendline defining the bearish momentum. The sellers will likely continue to lean on the trendline to keep pushing into new lows, while the buyers will look for a break higher to increase the bullish bets into a new all-time high.
Bitcoin Technical Analysis – 1 hour Timeframe
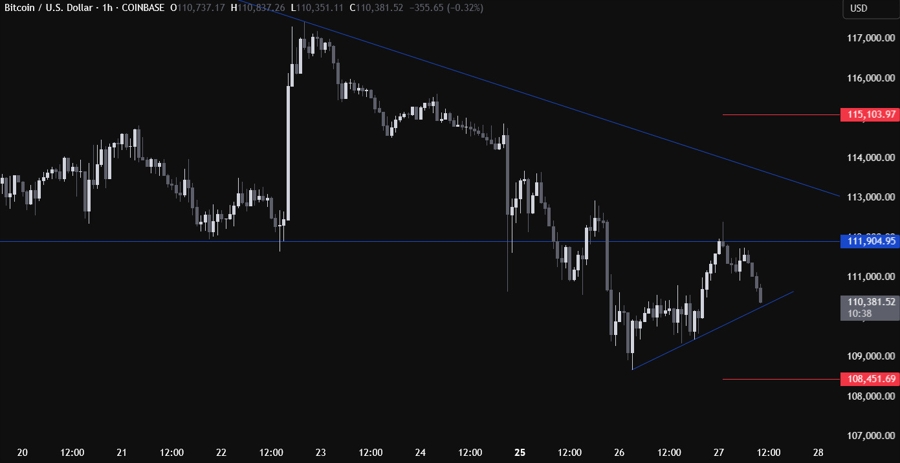
On the 1 hour chart, we can see that we have a minor upward trendline defining the bullish momentum on this timeframe. The buyers will likely lean on the trendline to keep targeting new highs, while the sellers will look for a break lower to extend the selloff into new lows. The red lines define the average daily range for today.
Upcoming Catalysts
Tomorrow we get the latest US Jobless Claims figures. On Friday, we conclude the week with the US PCE price index.
 Copy Link
 Share on Facebook
 Share on X
 Share by Email
