
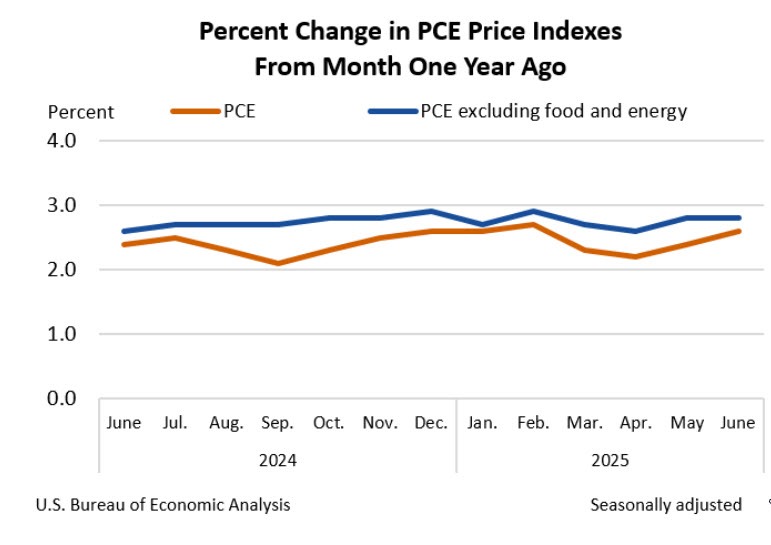
US core PCE for June YoY 2.8% vs +2.7% expected
Core:
- Prior was 2.7%
- YoY PCE 2.8% vs 2.7% est.
- MoM 0.3% versus 0.3% estimate
- PCE prices excluding food and energy and housing +0.3% versus 0.2% last month
- PCE services price excluding energy and shelter +0.2% versus +0.2% last month
- The unrounded was 0.2563% which rounded up to 0.3%. So it was just above the midpoint for rounding. .
Headline PCE:
- YoY 2.6% versus 2.5% expected
- MoM 0.3% versus 0.3% estimate
- Unrounded PCE 0.2805% rounded up to 0.3%
Looking at other data from the report :
- Personal income, it rose by 0.3% versus 0.2% and -0.4% last month
- Personal consumption rose 0.1% versus -0.2% last month (revised from -0.3%)
Other details from the BEA:
In June, U.S. personal income rose by $71.4 billion (0.3%), while disposable personal income increased by $61.0 billion (0.3%), according to the BEA.
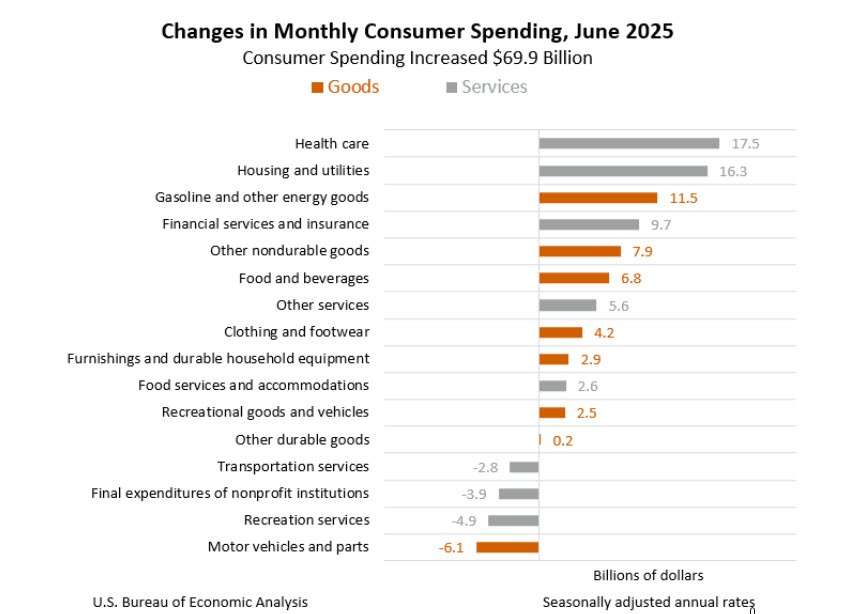
Personal consumption expenditures (PCE) also climbed $69.9 billion (0.3%). Total personal outlays grew by $69.5 billion, and the personal saving rate held at 4.5%, with $1.01 trillion in total personal savings for the month.
Overall, althought the core PCE was as expected at 0.3%, it was just above the "rounded up" level at 0.2563%. So overall, prices are near expectations with inflation still above the 2.0% but not running as fast as thought.
Personal consumption at 0.1% after -0.2% last month is not that great.
As the dust settles, the major stock indices are maintaining their gains:
- Dow industrial average up 118 points
- S&P index up 62 points
- NASDAQ index is up hundred and 20 points
 Copy Link
 Share on Facebook
 Share on X
 Share by Email
