
Why is Bitcoin Going Down Today? BTC Price Falls Below $109K Testing 2-Month Lows
The answer to "Why is Bitcoin going down today?" lies in a perfect storm of technical breakdowns, massive whale selling, and overleveraged positioning that has sent Bitcoin (BTC) price tumbling to its lowest levels in seven weeks.
The cryptocurrency has already tested levels below 109,000 dollars, and although it has rebounded above local support, the newest BTC price predictions and my technical analysis suggest that at this point Bitcoin may still have room for further declines.
Bitcoin Price Today: Current Market Data
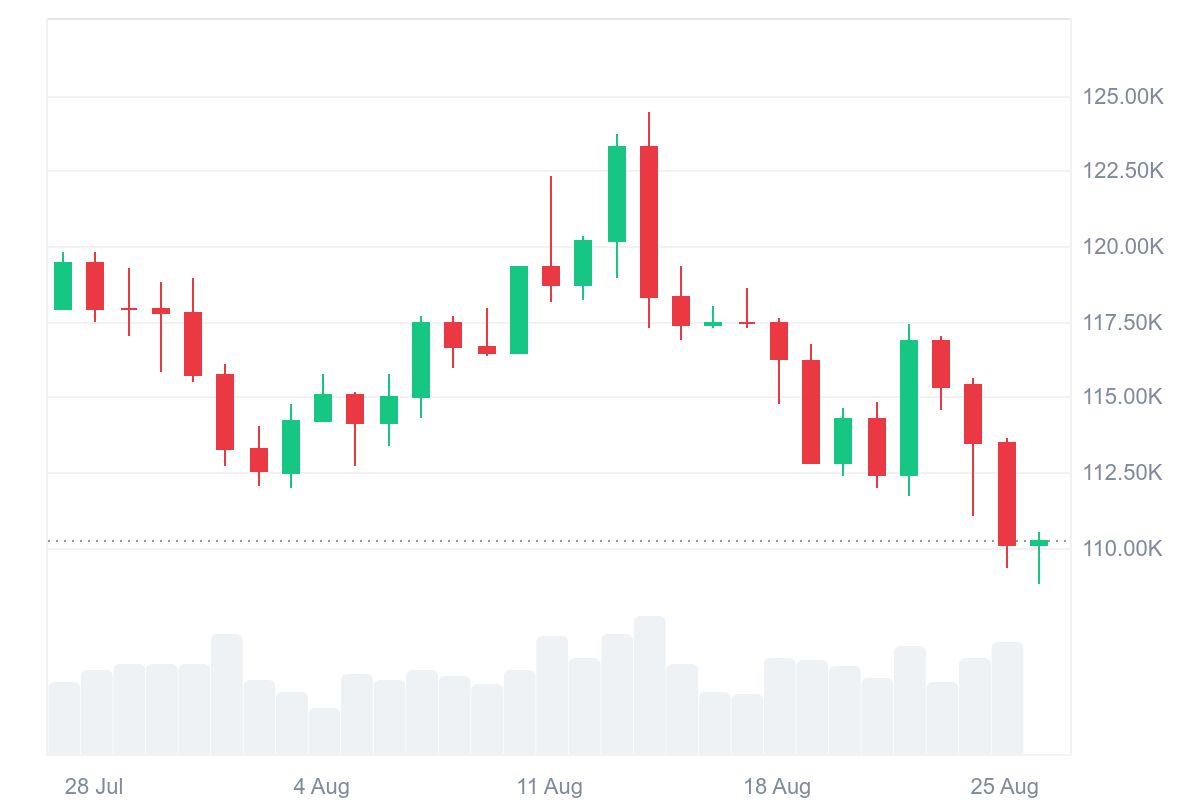
As of today (Tuesday), August 26, 2025, Bitcoin trades at $110,185, down 2.83% from yesterday and marking an 11% decline from its August 14 all-time high of $124,533.
Bitcoin's decline intensified after a major whale dumped 24,000 BTC worth over $2.7 billion, causing the cryptocurrency to briefly fall below $109,000 on Monday. The selling pressure erased all gains from Federal Reserve Chair Jerome Powell's dovish Jackson Hole speech, which had initially pushed Bitcoin above $117,000 on Friday.
Key Bitcoin price metrics:
- Current price: $110,185 (August 26, 2025)
- 24-hour change: -2.83%
- Weekly decline: -7% since Powell's speech
- Monthly correction: 11% from $124,533 ATH
- Market cap impact: Nearly $200 billion wiped from crypto markets
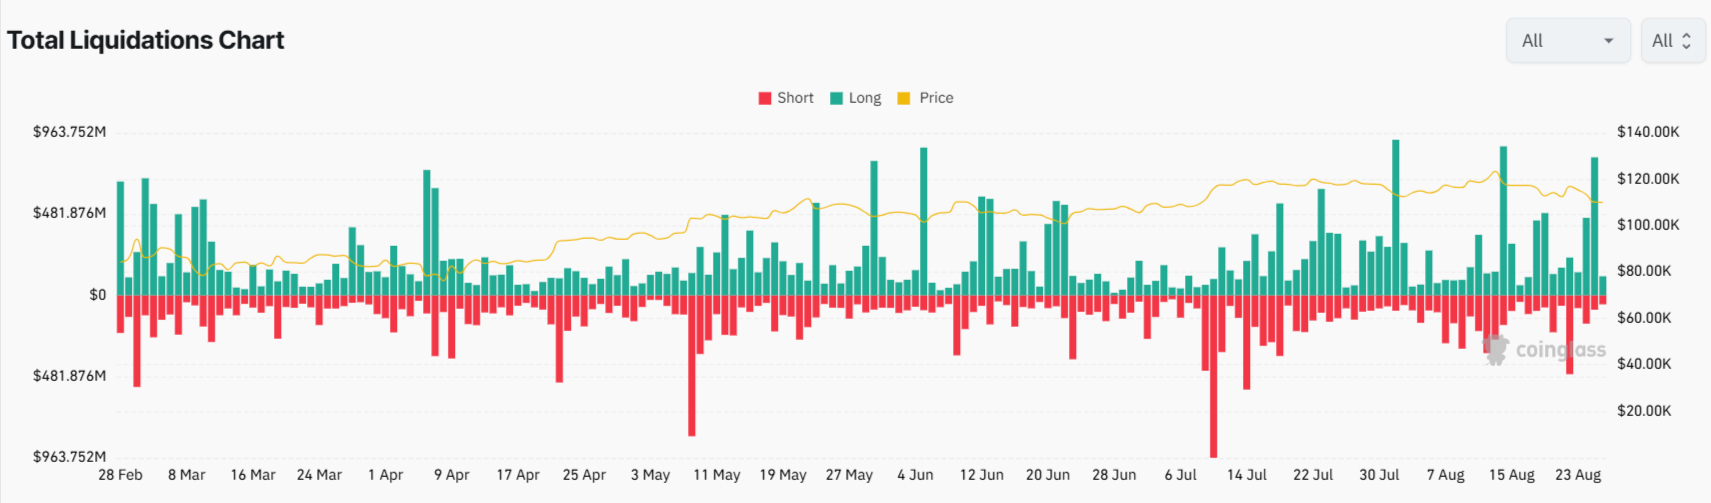
The selloff triggered the largest liquidation event of the year, with $900 million in leveraged positions getting forcibly closed across crypto derivatives markets.
Why is Bitcoin Price Going Down Today? 5 Main Reason
1. Whale Selling Triggers Flash Crash
eToro analyst Simon Peters confirms the primary catalyst: "Bitcoin has slumped lower and is now trading at $110,000 after a whale reportedly sold over 24,000 bitcoin (approximately $2.4 billion) on Sunday triggering a flash-crash". This whale, likely an early Bitcoin adopter from the "Satoshi era," had purchased Bitcoin at around $10 or lower, making current prices extremely profitable for exit strategies.
Yesterday saw one of the largest #Bitcoin long liquidation events since Dec 2024, with over $150M in longs wiped out as price moved lower. pic.twitter.com/okCNBMWl0j
— glassnode (@glassnode) August 25, 2025

2. Technical Breakdown Confirms Bearish Shift
Bitcoin's technical outlook deteriorated significantly, with the cryptocurrency falling below the 100-day simple moving average for the first time since April 22, 2025. The price also dropped below the Ichimoku cloud, indicating a bearish shift in momentum. These dual breakdowns mirror the February pattern that preceded a deeper selloff to $75,000.
3. Overleveraged Positioning Gets Squeezed
The sharp move resulted from overleveraged positioning particularly following recent run-ups. Bitcoin traders faced $277 million in forced liquidations, while Ethereum saw $320 million wiped out. Total liquidations across all cryptocurrencies exceeded $900 million, with 90% being long positions betting on higher prices.
4. Market Structure Reveals Fragility

Jamie Elkaleh, Chief Marketing Officer at Bitget Wallet, explains the deeper issue: "Bitcoin's flash crash highlighted the market's ongoing liquidity challenges. ETF outflows and weaker on-chain activity have left order books thin, meaning large transactions, like August's $2.7B whale sale, can quickly trigger cascading liquidations in over-leveraged futures markets."
5. Seasonal Headwinds Add Pressure
Peters notes an ominous pattern: "September tends to be a month of the year, more often than not, which has seen a negative performance for the bitcoin price." Historical data shows September brings the weakest returns for BTC with average losses of 3.77% during bull market years.
You may also like: Bulls Target $140K BTC as Crypto Rally Accelerates
Bitcoin Technical Analysis Targets $100K
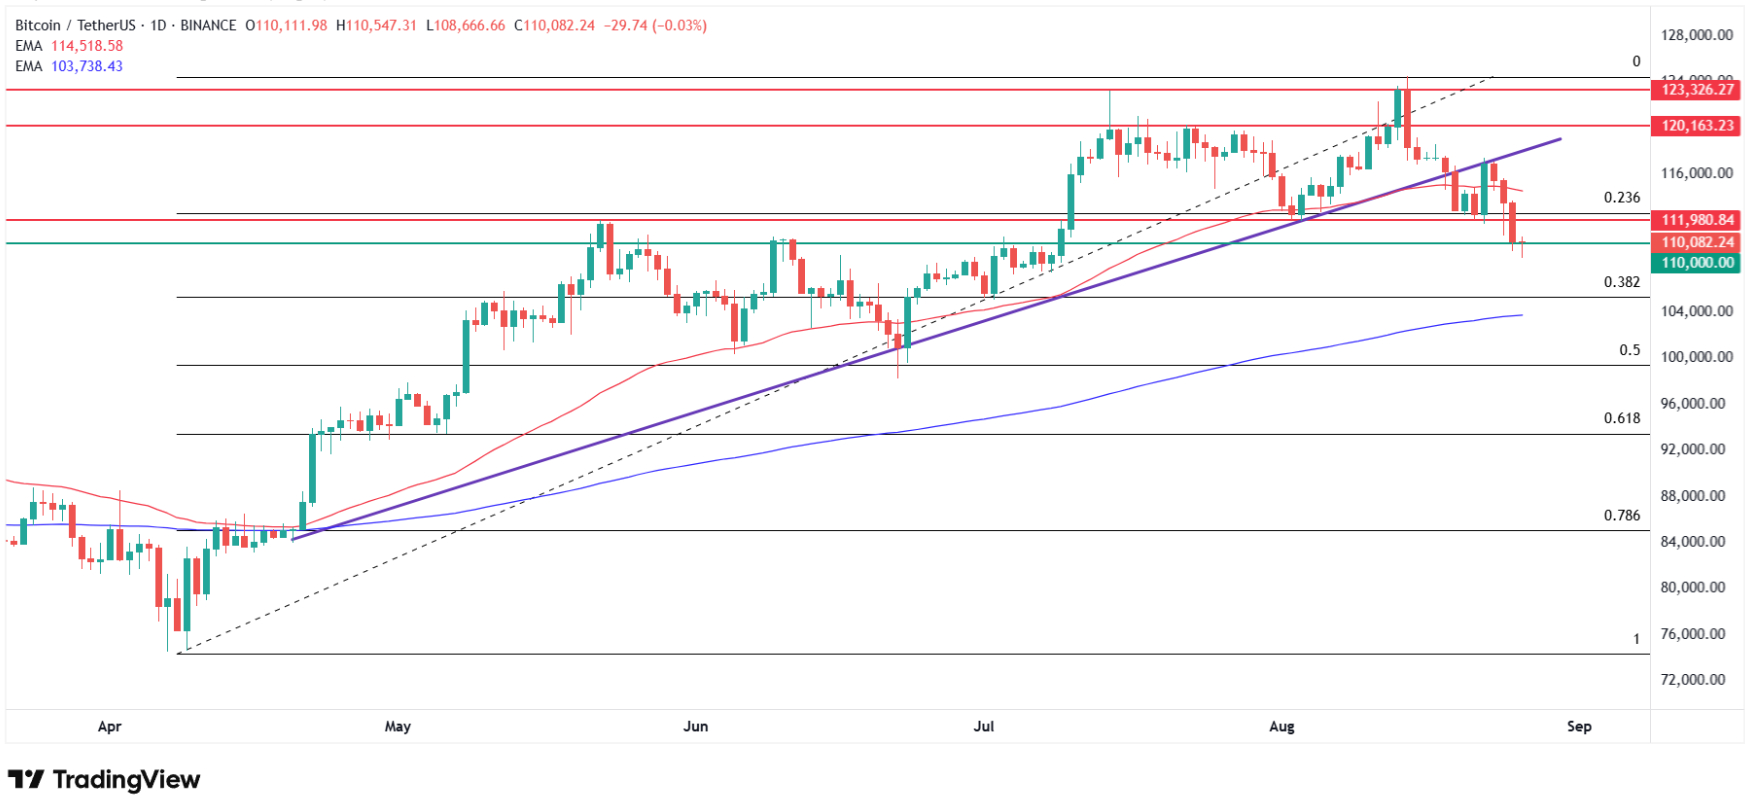
Based on my technical analysis, since breaking the trendline drawn from the April lows, bears have temporarily taken control of the BTC chart. At the moment, Bitcoin is testing the support zone located between 110,000 and 112,000 dollars.
If this zone is decisively breached, in my view, Bitcoin could open the way toward the 200 EMA, just below 104,000 dollars, and ultimately to the 50% Fibonacci retracement, which coincides with the psychological 100,000-dollar level.
Ethereum And XRP Price Down: Altcoins Are Falling Too
While Bitcoin suffered significant losses, other major cryptocurrencies showed varied performance. Ethereum (ETH) declined 8% over 24 hours but continues trading above its 100-day SMA and Ichimoku cloud, maintaining relative strength.
XRP held better ground, remaining above its 100-day moving average though stuck within the Ichimoku cloud, a zone of uncertainty. Solana (SOL) also maintained its position above key technical levels, suggesting potential outperformance if risk appetite returns.
The divergence suggests potential rotation from Bitcoin to altcoins, with analysts expecting Ethereum and SOL to outperform BTC if markets stabilize.
Bitcoin Price Prediction: Institutional vs Retail Divide
Bearish Scenarios Dominate
Technical analysts point to several downside targets if current support levels fail:
- $105,300 (38.2% Fibonacci retracement)
- $100,000 (psychological support and 200-day SMA)
- $75,000 (aggressive bear target, echoing Peter Schiff's prediction)
Market pricing shows 35% implied odds for Bitcoin to revisit $100,000 by September-end, up from 20% last week.
However, there are also voices suggesting that Bitcoin’s price could rebound toward $200,000 before the end of the year. Such an ambitious forecast has been presented, among others, by Standard Chartered.

"The weakness in the near-term conviction among retail traders has not recalibrated the conviction of institutional and sovereign buyers, who are quietly using this dip period to scale in and extend their BTC exposure," Leo Zhao, Investment Director at MEXC Ventures, commented. "Bitcoin now sits at a critical inflexion point, where it could enter a period of consolidation between $110,000 and $120,000. The long-term picture, however, remains underpinned by institutional accumulation. Bitcoin retains the structural foundation for another attempt at record highs of $130,000 before the EOY."
Institutional Accumulation Continues
Despite retail liquidations, Elkaleh notes a key divergence: "The split between retail liquidations and institutional accumulation reflects a market that is maturing. Retail traders, often exposed to high leverage, are forced out during corrections, while institutions use these episodes to accumulate strategically."
MicroStrategy's continued buying exemplifies this trend, with the company having accumulated over 628,000 Bitcoin worth more than $71 billion at current prices. Their strategy of buying near highs demonstrates institutional confidence in Bitcoin's long-term trajectory.
Economic Data Could Provide Relief
Peters sees potential catalysts ahead: "There may be some hope for the crypto markets to mark a comeback this week though, as we have more economic data in the form of GDP figures, unemployment claims and PCE inflation data coming out from the US. A slowing economy, higher unemployment claims and cooling inflation may boost cryptoasset prices."
FAQ: Bitcoin Price Decline
Why did Bitcoin crash below $110K today?
A whale sold $2.7B worth of Bitcoin, triggering massive liquidations and technical breakdowns below key moving averages.
What are the key support levels for Bitcoin?
$105,390 (38.2% Fibonacci) and $100,928 (200-day SMA) represent critical support zones.
Could Bitcoin fall further?
Yes. Technical patterns suggest potential drops to $100K or lower if current supports fail, with some targeting $75K.
Are institutions still buying Bitcoin?
Yes. Companies like MicroStrategy continue accumulating despite volatility, suggesting long-term confidence remains intact.
 Copy Link
 Share on Facebook
 Share on X
 Share by Email
