
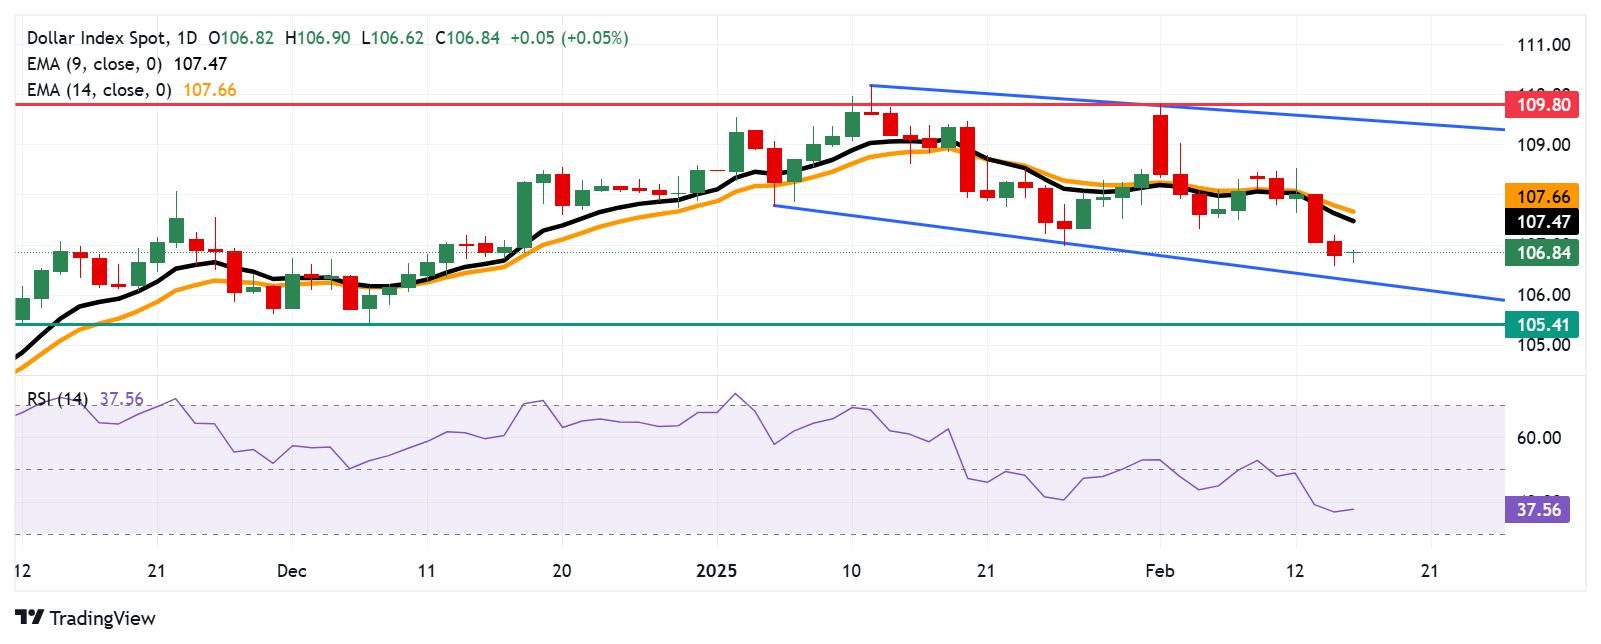
US Dollar Index Price Forecast: Remains near 107.00, lower descending channel boundary
- The US Dollar Index may find key support near the descending channel’s lower boundary at 106.30.
- The 14-day RSI is below 50, signaling increasing bearish momentum.
- The primary resistance appears at the nine-day EMA at 107.47
The US Dollar Index (DXY) edges higher after registering losses in the previous two consecutive sessions, trading around 106.90 during the European hours on Monday. A review of the daily chart suggests a prevailing bearish bias as the index consolidates within the descending channel pattern.
However, the 14-day Relative Strength Index (RSI) is positioned below the 50 level, indicating a strengthening bearish momentum. Furthermore, the US Dollar Index remains positioned below the nine- and 14-day Exponential Moving Averages (EMAs), confirming the short-term price momentum is weaker.
On the downside, the DXY could approach the lower boundary of the descending channel at 106.30 level, followed by the psychological level of 106.00. A break below this level could reinforce the bearish bias and put downward pressure on the index to test the three-month low at 105.41, which was recorded on December 6.
Regarding resistance, the DXY could find its primary resistance at nine-day EMA at 107.47, followed by 107.66. A decisive break above these levels would improve the short-term price momentum and support the pair to explore the region around the descending channel’s upper boundary at 109.50 level, followed by the five-week high of 109.80, last tested on February 3.
US Dollar Index: Daily Chart
 Copy Link
 Share on Facebook
 Share on X
 Share by Email
