
USDCHF Technical Analysis – The USD comes under pressure once again
Fundamental Overview
The US Dollar fell across the board in the final part of last week for two main reasons. The US PPI report came in higher than expected but the focus was on the details that feed into the Core PCE index, which is what the Fed focuses on. Those details were all very soft and helped to bring the early estimates down to more benign levels. In fact, the Core PCE Y/Y is now projected to fall to 2.6% vs. 2.8% in the prior month. That’s good news for the Fed.
Eventually, the bearish momentum increased substantially as the Trump’s tariffs saga came to an end. In fact, the US President announced his reciprocal tariffs that could go into effect in April but the overall tone of it wasn’t aggressive and sounded a lot like the start of a negotiating process to bring tariffs to a fair level for everyone.
On the CHF side, the Swiss CPI last week came in line with expectations although the core measure increased. It didn’t change much for the SNB, but the market scaled back the expectations for potential negative rates which boosted the Swiss Franc.
USDCHF Technical Analysis – Daily Timeframe
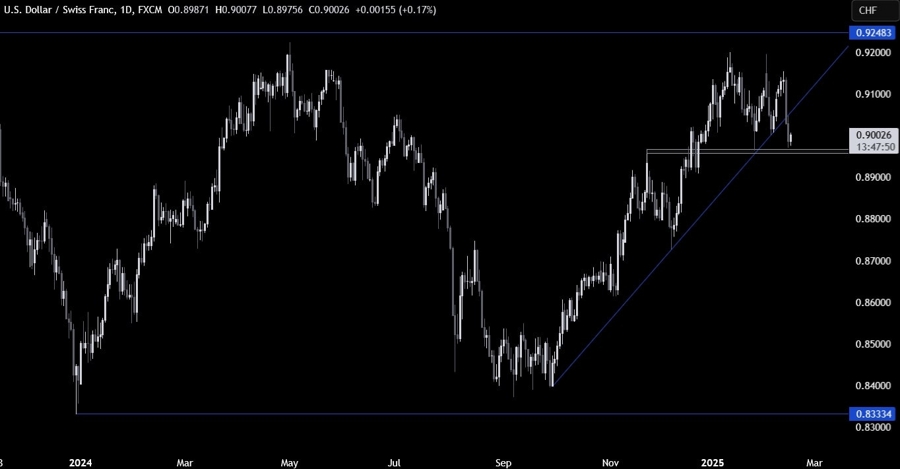
On the daily chart, we can see that USDCHF broke below the major trendline and bounced around the 0.8960 support zone. The buyers stepped in there with a defined risk below the support to position for a rally back into the 0.92 handle. The sellers, on the other hand, will want to see the price breaking lower to increase the bearish bets into the 0.87 handle next.
USDCHF Technical Analysis – 4 hour Timeframe

On the 4 hour chart, there’s not much we can glean from this timeframe as the price is trading in the middle of the broken trendline and the key support zone. If we go get a pullback into the trendline, we can expect the sellers to pile in around those levels to position for the break below the support, while the buyers will look for a break above the trendline to increase the bullish bets into the 0.92 handle next.
USDCHF Technical Analysis – 1 hour Timeframe
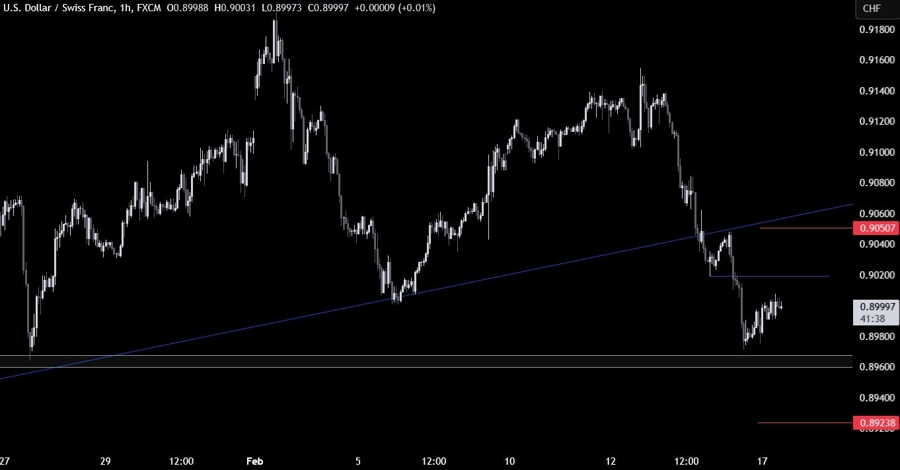
On the 1 hour chart, on an intraday basis, we might see the sellers lean on the most recent lower low to push into the key support, while the buyers will look for a break higher to extend the pullback into he trendline. The red lines define the average daily range for today.
Upcoming Catalysts
This week is pretty empty on the data front with the most important releases scheduled for the latter part of the week. On Thursday, we get the latest US Jobless Claims figures, while on Friday we conclude with the US Flash PMIs.
 Copy Link
 Share on Facebook
 Share on X
 Share by Email
