USD/JPY struggles amid trade tensions, pair capped below key moving averages
USD/JPY price analysis: Dollar struggles amid trade tensions, pair capped below key moving averages
- USD/JPY trades around the 143 zone during Wednesday's North American session
- US tariffs, weaker yields, and trade risks weigh on the Dollar's broader outlook
- Technical resistance seen near 145.50–145.80 zone, while 142.40 offers key support
The USD/JPY pair holds a modest upside bias during Wednesday’s North American session, hovering around the 143 handle. Despite the intraday uptick, the broader tone remains cautious as the US Dollar stays under pressure in the face of escalating trade tensions and falling Treasury yields. The Japanese Yen, typically a safe haven during geopolitical flare-ups, has struggled to capitalize fully amid crosswinds in equity markets and monetary divergence.
On the fundamental front, market sentiment has turned fragile following US President Donald Trump’s decision to explore new tariffs on critical mineral imports. These proposed levies come atop already substantial reciprocal tariffs in the ongoing US-China trade standoff. Meanwhile, China responded with rare earth export restrictions, raising concerns about supply chain disruptions in key industries such as technology and defense. Though both sides have shown openness to resume negotiations, rhetoric from Beijing emphasized the need for mutual respect.
While US economic data has been relatively firm—March Retail Sales rose 1.4%, slightly above expectations—investors continue to divest from the Greenback, reflecting broader anxiety around global trade and monetary policy. The US Dollar Index slipped further on the day, undermining USD/JPY’s ability to extend gains.
Technical Analysis
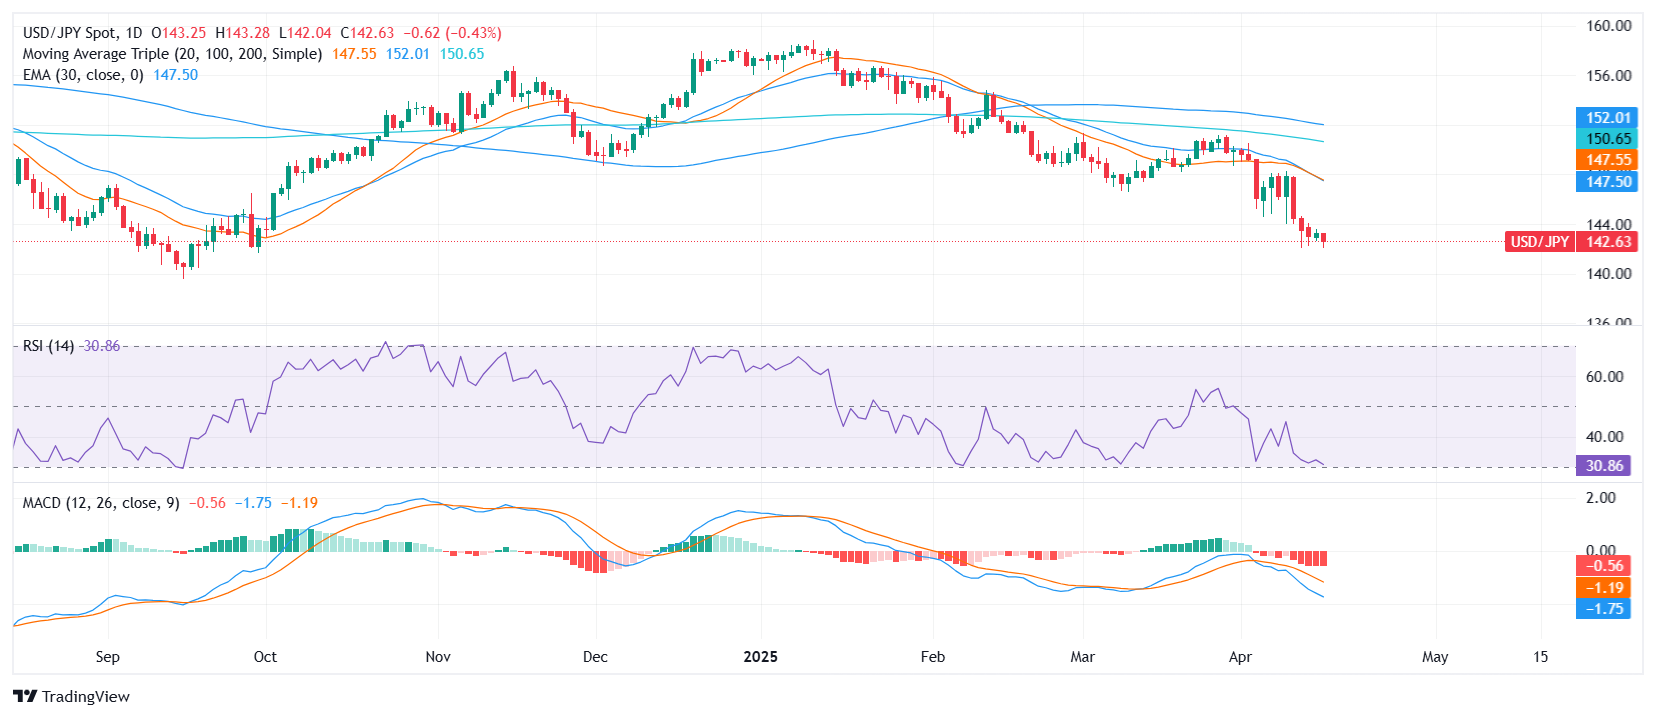
From a technical perspective, the USD/JPY pair is showing a mixed picture. The Moving Average Convergence Divergence (MACD) is flashing a sell signal, suggesting weakening momentum. Meanwhile, the Relative Strength Index (RSI) stands near 32, indicating the pair is nearing oversold territory. The 20-, 100-, and 200-day Simple Moving Averages all point to further downside, reinforcing the broader bearish outlook. The Williams Percent Range signals a potential bounce, but other indicators remain neutral.
Key support is seen around 142.41, with further downside targets at 141.80. On the upside, resistance lies at 145.47, followed by 145.79 and 146.62. Unless bulls manage to break decisively above the confluence of moving averages, upside attempts may continue to face headwinds.


