
Gold Technical Analysis – Lack of bullish catalysts keeps the market rangebound
Fundamental Overview
Gold eventually extended the losses ever since rejecting the key 3,438 resistance last week. The trade deals and lack of bullish catalysts didn’t help the market as we now head into the FOMC decision due tomorrow.
The Fed is expected to keep everything unchanged and might just keep the door open for a rate cut in September if they get more benign inflation figures by then.
I would say that the NFP report on Friday is more important at this point as softer data could give the Fed more reasons to cut in September or even deliver more rate cuts than currently expected.
Conversely, stronger data might keep them on the sidelines for longer especially if the inflation outlook remains skewed to the upside.
In the bigger picture, gold should remain in an uptrend as real yields will likely continue to fall amid Fed easing. But further hawkish repricing in interest rates expectations could trigger corrections in the short term.
Gold Technical Analysis – Daily Timeframe

On the daily chart, we can see that gold broke below the major trendline recently and extended the losses as more sellers started to pile in. The target should be the key swing level at 3,120 where we will likely find dip-buyers positioning for a move back into the 3,438 resistance.
Gold Technical Analysis – 4 hour Timeframe
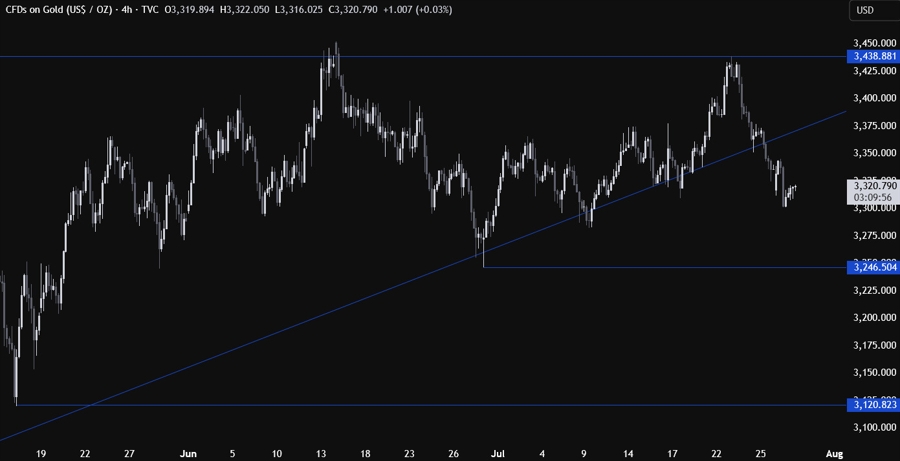
On the 4 hour chart, there’s not much we can glean from this timeframe as we don’t have any meaningful level where to lean onto. The bearish momentum will likely continue into the 3,246 level due to lack of bullish catalysts ahead of the FOMC decision tomorrow.
Gold Technical Analysis – 1 hour Timeframe
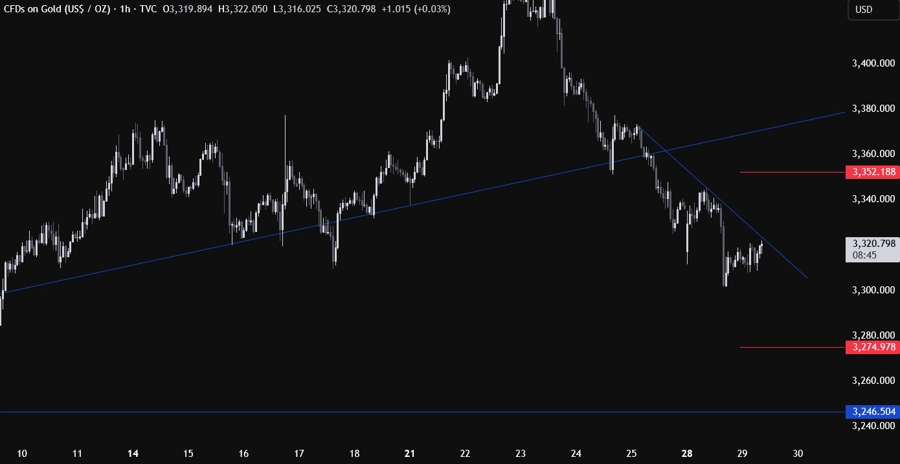
On the 1 hour chart, we can see that we have a minor downward trendline defining the bearish momentum. The sellers will likely continue to lean on the trendline with a defined risk above it to keep pushing into new lows, while the buyers will look for a break higher to target a move into the major broken trendline around the 3,370 level. The red lines define the average daily range for today.
Upcoming Catalysts
Today we have the US Job Openings and Consumer Confidence data. Tomorrow, we have the US ADP, the US Q2 GDP and the FOMC rate decision. On Thursday, we get the US PCE price index, the US Jobless Claims and the US Employment Cost Index. Finally, on Friday, we conclude the week with the US NFP report and the US ISM Manufacturing PMI.
 Copy Link
 Share on Facebook
 Share on X
 Share by Email
