US PPI final demand MoM 0.0% versus 0.2% estimate. YoY 2.3% vs 2.5% estimate

- Prior month 0.1% MoM revised to 0.3%. Prior month year on year 2.6% revised to 2.7%
- PPI final demand MoM 0.0 % versus 0.2% estimate
- PPI Ex food and energy MoM 0.0% versus 0.2% estimate
- PPI Final Demand YoY x.x% vs 2.5% estimate. Prior month 2.6% revised to 2.7%
- PPI Final Demand ex food and energy 2.6% % vs 2.7% estimate. Prior month 3.0% revised to 3.2%
In other:
- PPI ex food and energy/trade MoM 0.0% vs 0.1% last month
- PPI ex food and energy/trade YoY 2.5% vs 2.7% last month revised to 2.8%
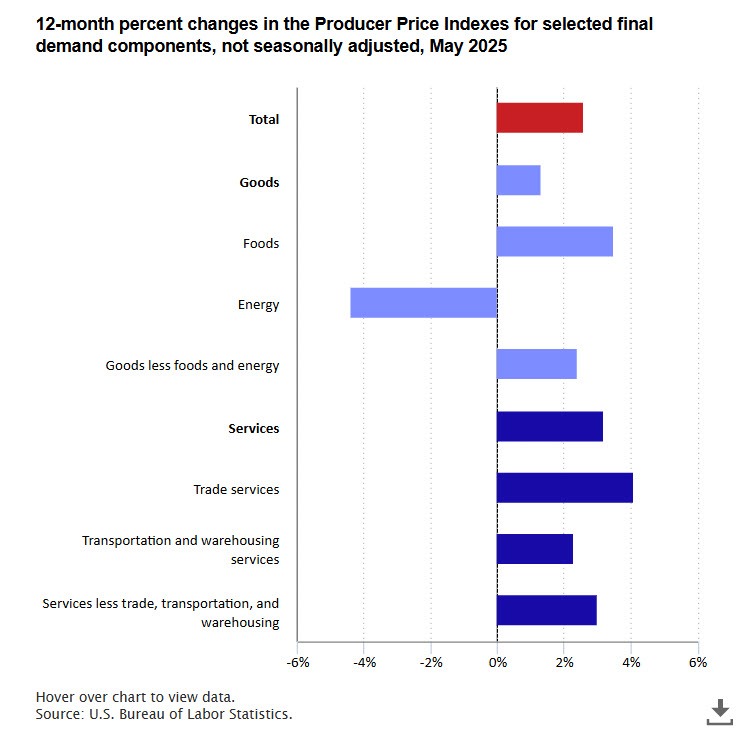
Details on the Goods and Services from the BLS shows:
Final Demand Goods – June
Prices rose 0.3%, largest increase since February (+0.3%)
Over half of the rise came from final demand goods less foods and energy (+0.3%)
Final demand energy prices rose 0.6%
Final demand food prices increased 0.2%
Product-level details:
Increases:
Communication & related equipment +0.8%
Gasoline, residential electric power, poultry, meats, and tree nuts also rose
Declines:
Chicken eggs −21.8%
Natural gas liquids and thermoplastic resins/plastics also declined
Final Demand Services – June
Prices edged down 0.1% (vs. +0.4% in May)
Main driver: Services less trade, transport, and warehousing down 0.1%
Transportation & warehousing services fell 0.9%
Trade margins were unchanged
Product-level details:
Largest drag: Traveler accommodation services −4.1%
Other declines: Auto/parts retailing, deposit services (partial), airline services, food & alcohol wholesaling
Increases:
Portfolio management +2.2%
Machinery/equipment wholesaling, furniture retailing, apparel/jewelry/footwear retailing also
According to some number crunchers, the early call on the components from the PPI that track into the core PCE keep the MoM in the 0.3% to 0.4% range (but on the lower end).
The US stocks are positive after the report:
- S&P +14.74 points
- Dow up 168 points
- Nasdaq up 18 points


