
Bitcoin Technical Analysis - Buyers continue to pile in around a key support zone
Fundamental Overview
The strong rally we've seen in the past few weeks stalled recently despite strong US economic data and lower than expected US inflation figures. The main macro drivers for bitcoin are growth expectations and liquidity, which have been both positive since the April 9 bottom.
Looking ahead, we have the August 1 tariff deadline that might keep the markets more on the defensive, but it certainly wouldn't be the first time that Trump postpones a deadline or tones down his threats. So, the probabilities are more skewed for positive outcomes.
Nevertheless, the path of least resistance should remain to the upside given the lack of bearish drivers. The risks ahead include another growth scare from tariffs or a more hawkish repricing in interest rates expectations.
Bitcoin Technical Analysis - 4 hour Timeframe
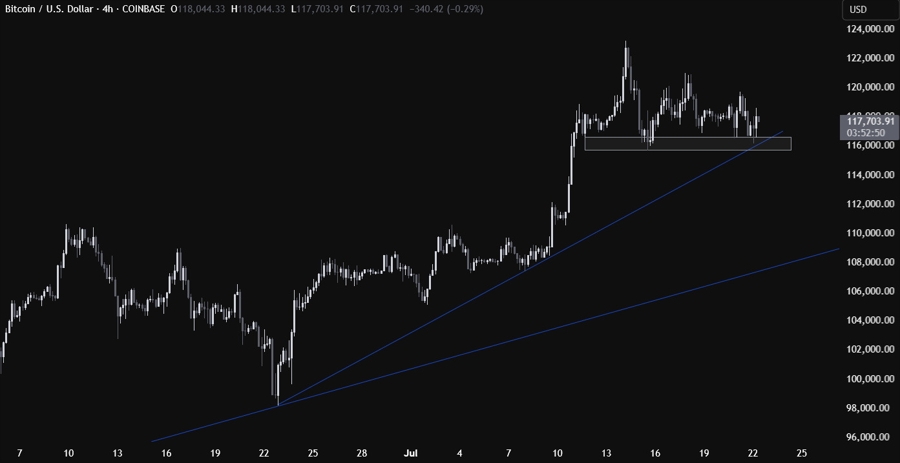
On the 4 hour chart, we can see that the price continues to bounce from a key support zone around the $116,000 level where the dip-buyers keep on stepping in with a defined risk below the trendline to target new all-time highs. The sellers will need a break below the support to open the door for a deeper correction into the next major trendline around the $110,000 level.
Bitcoin Technical Analysis - 1 hour Timeframe

On the 1 hour chart, we can see that the recent price action formed a descending triangle. The price can break on either side of the pattern but what follows next is generally a sustained move in the direction of the breakout.
investingLive.com (formerly ForexLive.com) is your new companion for the latest financial market news and analysis
 Copy Link
 Share on Facebook
 Share on X
 Share by Email
