Why Is Crypto Going Down? Bitcoin Falls to $117K Today, Dragging XRP, Dogecoin and Ethereum Prices Lower
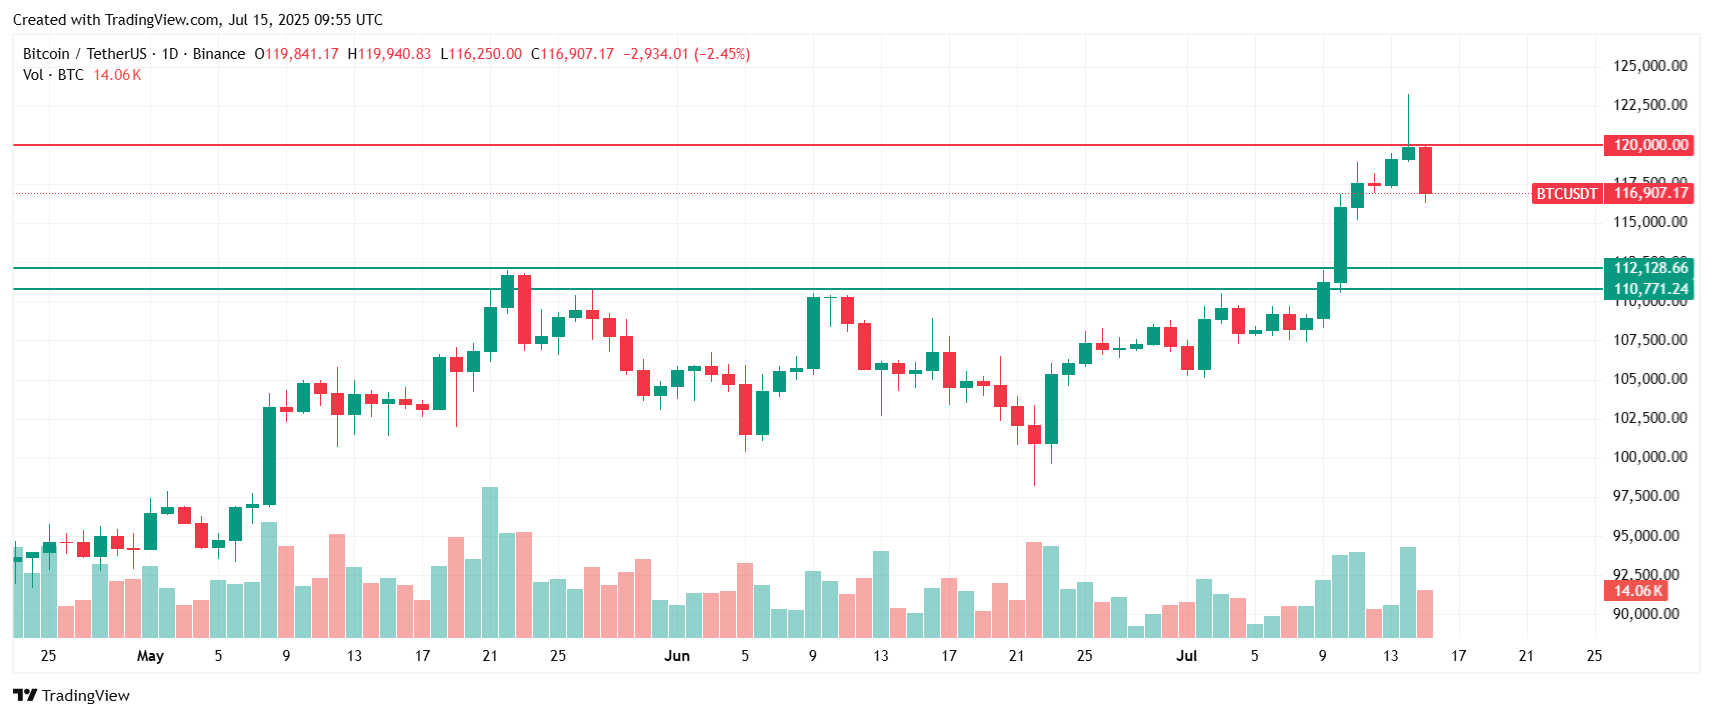
Cryptocurrency markets experienced significant volatility on Wednesday, July 15, 2025, with Bitcoin (BTC) prices falling below $117,000 after reaching a record high of $123,000. The world's largest cryptocurrency currently trades at approximately $117,550, representing a 5% decline from its Monday peak as investors engaged in profit-taking activities following the historic rally.
Ethereum (ETH) has also faced selling pressure, trading below $3,000, while XRP experienced an 5% drop from $3.02 to $2.78. Dogecoin emerged as the worst performer among major cryptocurrencies, plunging 8% and leading market losses.
Why is the crypto going down today? The crypto market correction follows one of the most significant profit-realization events of the year, with investors collectively realizing $3.5 billion in profits over the past 24 hours. This massive sell-off has created substantial market volatility and raised questions about the sustainability of recent gains.
Bitcoin Price Retreats from Record High Amid Whale Activity
Bitcoin's recent rise to $123,000 on Monday quickly reversed as long-term holders cashed out significant positions. According to Glassnode data, long-term holders, defined as those who bought more than 155 days ago, accounted for 56% of the total profit-taking, realizing $1.96 billion in gains.
The cryptocurrency's rapid ascent from $108,000 to $123,000 created a notable supply gap between $110,000 and $116,000, leaving the market vulnerable to sharp price movements in either direction. This technical weakness has contributed to the current volatility as traders navigate the lack of established support levels in this range.

"Following any 2 to 3 standard deviation price move as seen over the weekend, we can almost guarantee mean reversion,” commented Paul Howard from Wincent. “The short liquidations caused by ETF inflows spiked the price and it may be the case we now see profit taking that moves Bitcoin back to a $110,000-$115,000 range.”
Whale activity on Binance has surged dramatically following Bitcoin's all-time highs. The Binance Whale Activity Score shows increased large-holder behavior, with whales depositing approximately 1,800 BTC onto the exchange on Monday. Transactions over $1 million accounted for more than 35% of total Bitcoin inflows to the exchange, indicating concentrated selling pressure from major players.
CryptoQuant analyst Crazzyblockk noted that this surge in deposits suggests “large-scale investors are either preparing to secure gains after the historic run to $122,000 or are planning to utilize Binance's deep liquidity to hedge or open new positions amid peak volatility.”
Dogecoin Leads Altcoin Losses with 10% Plunge
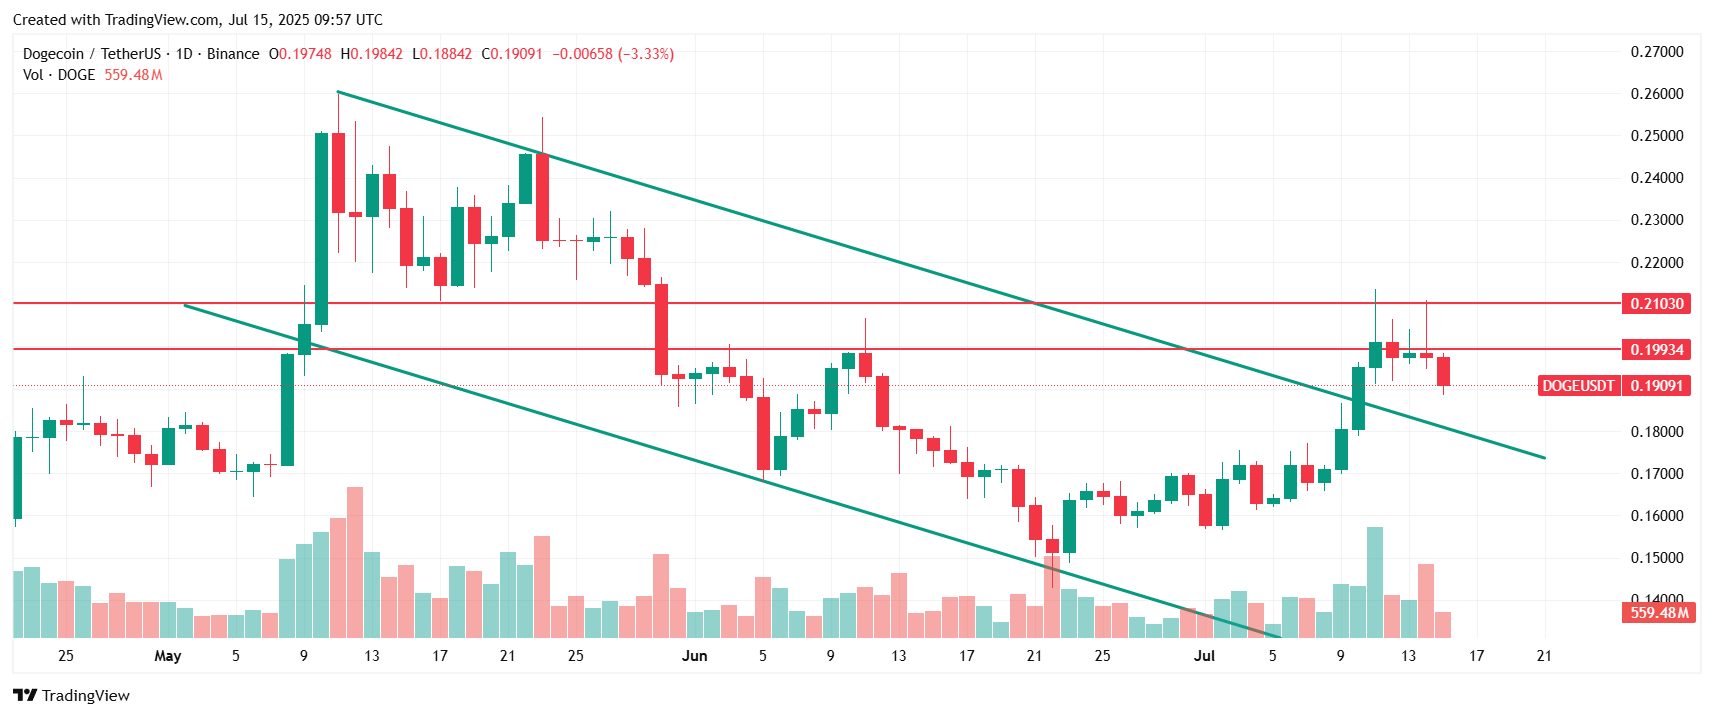
Dogecoin experienced the most severe decline among major cryptocurrencies, dropping 8% from $0.21 to $0.18. The meme-inspired token saw significant selling pressure during two key trading windows, with volume spikes of 735.09M and 704.60M crushing the 24-hour average of 415.48M.
As shown on the technical chart below, local resistance has halted further gains, and the price may now be heading back toward the downward channel that has been forming since May.

However, institutional activity was evident on both sides of the move, suggesting strategic capital flows rather than retail-driven volatility. The selloff coincided with rising anxiety over delays in potential crypto ETF approvals and increased U.S. regulatory discussions around centralized exchanges.
Related: Why Dogecoin Price Is Surging? Breaking News and Price Predictions for July 2025
XRP Faces Resistance at $3 Ahead of ETF Launch
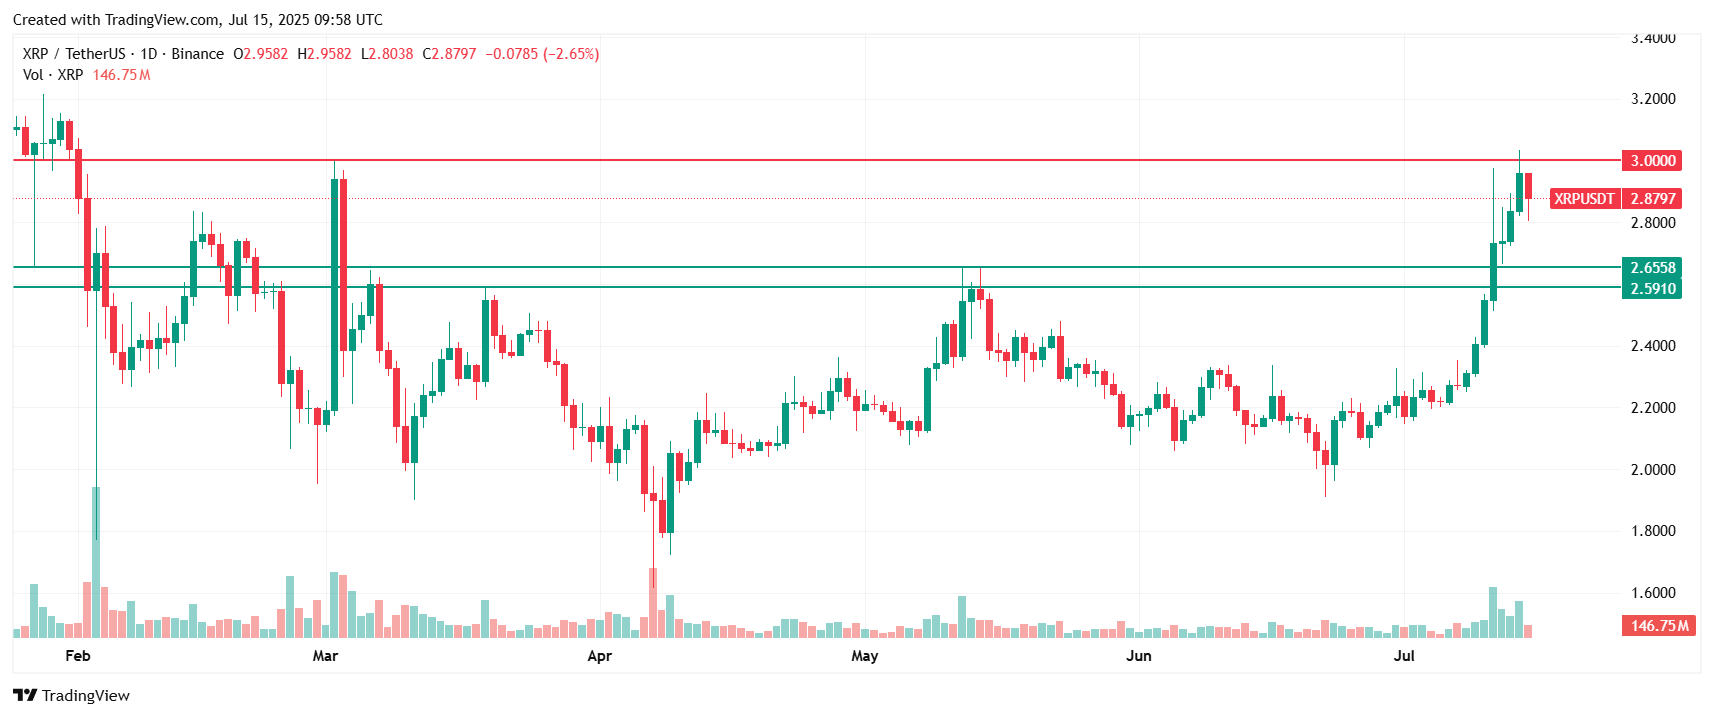
XRP tumbled 8% from $3.02 to $2.78 between July 14 and July 15, encountering strong resistance at the $3.00 level. The decline occurred despite an initial morning rally that saw coordinated buying push the token to $3.02 before systematic profit-taking set in.
The selloff aligns with institutional de-risking ahead of the ProShares XRP Futures ETF launch scheduled for July 18. Corporate treasuries are rebalancing exposure amid regulatory uncertainty, with the SEC's unresolved digital asset framework continuing to dominate institutional risk models.
Based on my technical analysis, the price may currently be consolidating between the previously mentioned $3 level and the support zone defined by the May highs, around $2.59–$2.65.

Ethereum Price Stops Below $3K Mark
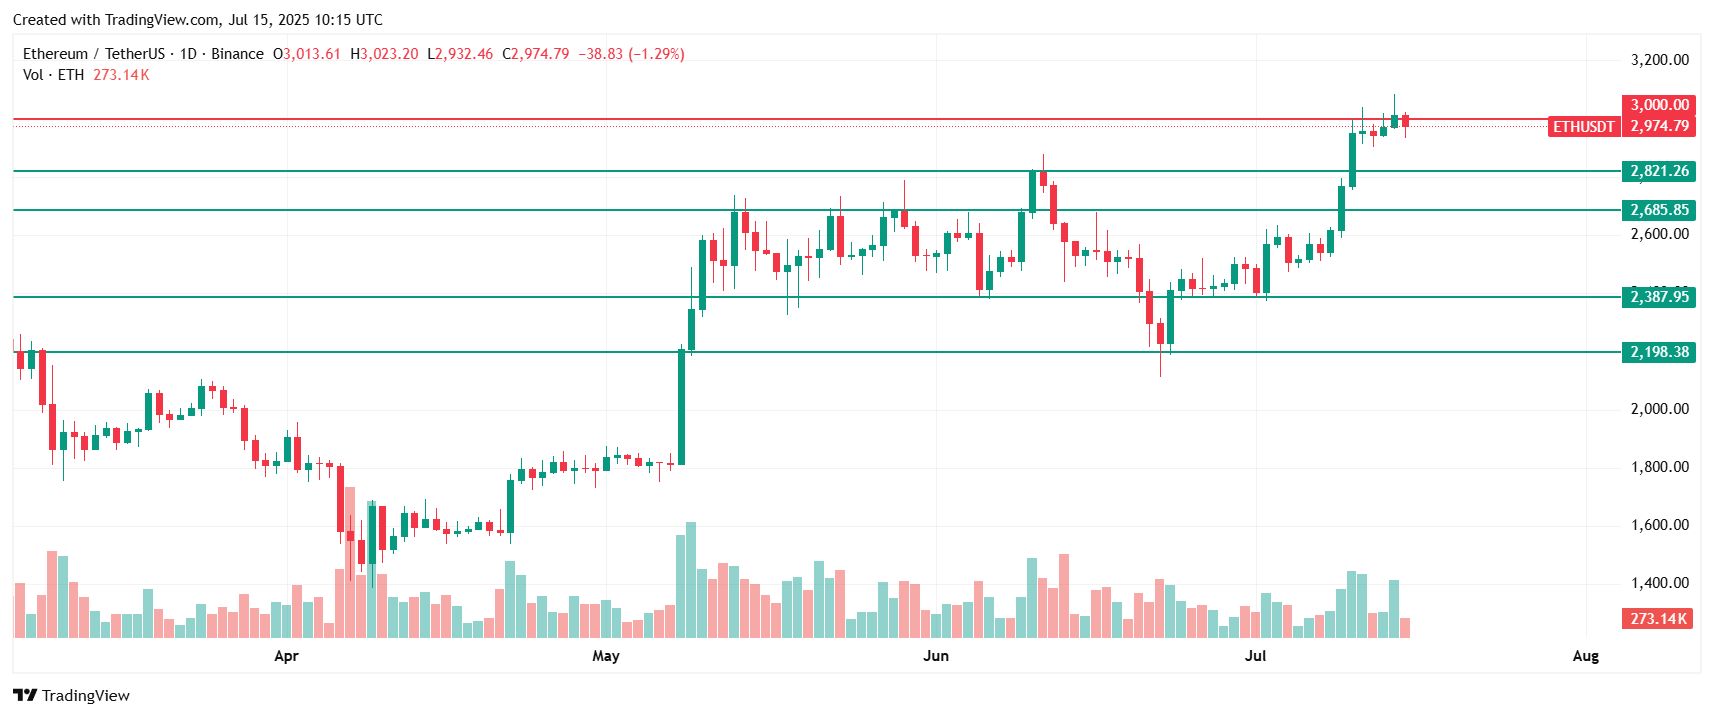
During Monday’s session, Ethereum tested its highest levels since February, briefly approaching $3,100. However, most of that move was erased before the session closed, with the second-largest cryptocurrency by market capitalization retreating to the psychological level of $3,000.

Profit-taking across all major cryptocurrencies on Tuesday also pushed Ethereum lower. At the time of writing, it is down 1.3%, trading just below technical resistance at $2,975. Although the cryptocurrency managed to break out of the consolidation range observed from May through mid-July, there is now a renewed risk that the price could fall back below $2,820—the upper boundary of that previous sideways pattern.
The lower end of that range sits near $2,200, corresponding to the June lows. That level could mark a potential end to a deeper correction, should one occur. For now, however, there is no clear indication of such a move. As usual, much will depend on what Bitcoin does next.
You may also like: Ethereum (ETH) Price Prediction: Why the Ethereum Price Is Going Up and Where the ETH Price Is Set to Go
Why is Crypto Going Down? 3 Key Reasons
Massive Liquidations Amplify Market Downturn
The cryptocurrency market witnessed one of its heaviest liquidation events since April, with over $675 million wiped out in 24 hours. Long traders bore the brunt of the damage, facing liquidations exceeding $406 million, while short-side losses contributed an additional $269 million to the total figure.
Bitcoin longs suffered the most significant impact with over $333 million in forced closures, followed by Ethereum at $113 million and XRP at $36 million. The largest single liquidation involved a $98.1 million BTC/USDT long position on Binance, highlighting the scale of leveraged positions unwinding during the sell-off.

Despite Bitcoin trading near record highs, elevated funding rates have made leveraged bets increasingly expensive, prompting caution among traders. QCP Capital noted in a client update that “funding rates are elevated, and the memory of February's $2 billion liquidation event still lingers.”
“My personal sense is we have set a new level not just with the all time highs (ATH) but also several key levels with buyers moving limits from $80,000 to $100,000 and some further support at the $110,000 level,” added Howard.
Federal Reserve Policy and Macroeconomic Pressures
The cryptocurrency market's volatility occurs against a backdrop of macroeconomic uncertainty and Federal Reserve policy speculation. The dollar held near a three-week high as traders awaited U.S. inflation data that could provide clues about the path for monetary policy.
Fed Chair Powell has indicated expectations for inflation to increase during the summer due to tariffs, which could keep the central bank on hold until later in the year. Economists polled by Reuters expect headline inflation to rise to 2.7% annually, up from 2.4% the prior month, while core inflation is projected to increase to 3.0% from 2.8%.
President Trump's continued criticism of Fed Chairman Jerome Powell has added another layer of uncertainty, with the president stating that interest rates should be at 1% or lower rather than the current 4.25% to 4.50% range.
Technical Analysis Points to Potential Further Declines
Technical indicators suggest Bitcoin faces critical support levels that could determine its near-term direction. The cryptocurrency has created a CME futures gap between $114,380 and $115,630, which historically tends to get “filled” through price action.
Source: Tradingview.com
Crypto analyst Mikybull Crypto suggested that Bitcoin will “probably fill up the CME gap during the CPI release and continue the rally up,” while MN Capital founder Michael van de Pope pointed to the possibility of a deeper correction toward $108,000.
PROBABLY FILL UP THE CME GAP DURING THE CPI RELEASE AND CONTINUE RALLY UP pic.twitter.com/9T3hRatg8M
— Mikybull 🐂Crypto (@MikybullCrypto) July 15, 2025
The key technical level to watch is $108,000, with van de Pope noting that “staying above $108K and the trend remains upward. The bull market is here.” A break below this level could signal more significant downside pressure for the leading cryptocurrency.
How High Can Crypto Go? Market Price Predictions
Despite the current weakness, analysts remain cautiously optimistic about cryptocurrency markets' longer-term prospects. Bitget's Ryan Lee noted that “the road to $150,000 by Q3 looks increasingly plausible, powered by ETF inflows, supply constraints, and macro tailwinds like a weakening dollar and potential Fed cuts.”
Bitcoin Price Prediction Table
Source/Analyst | Price Target | Timeframe | Key Drivers |
Standard Chartered | $200,000 | End of 2025 | Institutional adoption, macroeconomic conditions |
Cathie Wood (Ark Invest) | $1,000,000 | Within 5 years | Finite supply, global store of value adoption |
Bitwise | $230,000 | Current “fair value” | US fiscal instability, scarcity, sovereign debt concerns |
Bitfinex | $120,000–$125,000 | Mid-2025 | Favorable macroeconomic developments |
Tom Lee (Fundstrat) | $150,000–$250,000 | End of 2025 | Supply-demand imbalances, global liquidity |
VanEck | $180,000 | 2025 (cycle apex) | Dual-peak cycle pattern |
The cryptocurrency market's resilience will likely depend on its ability to navigate ongoing macroeconomic pressures while maintaining institutional interest. Standard Chartered's recent launch of Bitcoin and Ethereum spot trading for institutional clients demonstrates continued corporate adoption despite current volatility.
XRP Price Prediction Table
Source/Analyst | Price Target | Timeframe | Key Drivers |
John Squire | $3.63 | Near term | Falling wedge breakout, ETF approval |
EGRAG | $27 | 2026 | ETF approval, 600–1,000% rally |
Standard Chartered | $8.00 | 2026 | Continued institutional adoption |
Sistine Research | $33–$50 | 2030 | Cup-and-handle pattern |
Sistine Research | $77–$100 | 2030 (stretched) | Extended cup-and-handle target |
Armando Pantoja | $100+ | Long-term | Cross-border payment adoption |
Duefe | $500 | 2029 | Post-2028 Bitcoin halving effects |
Options data suggests cautious optimism among traders, with September and December risk reversals still favoring call options, indicating longer-term bullishness despite near-term reluctance to chase upside momentum.
Crypto News FAQ
Why Is Cryptocurrency Going Down Now?
The cryptocurrency market is experiencing a significant correction following Bitcoin's historic rally to $123,000 on July 14, 2025. The primary drivers include massive profit-taking by long-term holders who realized $3.5 billion in profits over 24 hours, increased whale activity on Binance with 1,800 BTC deposited, and over $675 million in liquidations across the market. Technical vulnerabilities emerged from Bitcoin's rapid price movement, creating a supply gap between $110,000 and $116,000, while macroeconomic uncertainty and Federal Reserve policy speculation added additional pressure to risk assets.
Will Crypto Recover in 2025?
Multiple analysts remain bullish on cryptocurrency prospects for the remainder of 2025 despite current turbulence. Institutional adoption continues with Standard Chartered launching Bitcoin and Ethereum spot trading, while the upcoming ProShares XRP Futures ETF launch demonstrates growing acceptance. Supply constraints, technical analysis showing bull market structure intact above $108,000, and options data reflecting longer-term bullishness all support recovery scenarios. Bitget's Ryan Lee noted that “the road to $150,000 by Q3 looks increasingly plausible,” though short-term volatility may persist with potential consolidation in the $105,000–$115,000 range.
Why Are All Crypto Going Down Together?
Cryptocurrency markets exhibit high correlation during stress periods, causing synchronized declines across Bitcoin, Ethereum, XRP, and Dogecoin. This occurs due to risk-off sentiment affecting the entire ecosystem, leverage unwinding creating systemic pressure across multiple tokens, and algorithmic trading systems executing similar strategies simultaneously. The $675 million in liquidations demonstrated this correlation: Bitcoin longs faced $333 million in forced closures, Ethereum $113 million, XRP $36 million, while Solana and Dogecoin each lost around $14 million. Institutional portfolio rebalancing and liquidity constraints during volatile periods further amplify these synchronized movements.
Will Crypto Rise Again?
Historical precedent strongly suggests cryptocurrency markets will recover from current weakness, as the industry has consistently reached new all-time highs after significant corrections. Fundamental drivers remain intact with continued ETF inflows, regulatory clarity around stablecoins, and expanding institutional infrastructure including new ETF products. Technical indicators support eventual recovery if Bitcoin maintains support above $108,000, confirming the bull market structure continuation. Potential Federal Reserve rate cuts and dollar weakness could drive increased interest in alternative assets, with Standard Chartered maintaining a $200,000 Bitcoin target by end of 2025 and multiple analysts projecting significant gains throughout the year.


