
Gold Technical Analysis – Awaiting Fed Chair Powell
Fundamental Overview
This week we haven’t got any major change in the fundamentals and Gold continued to trade in a tight range ahead of Powell’s speech and the NFP report in September. Right now, there’s still uncertainty around the interest rates outlook as a hot NFP in September could flip expectations pretty quickly.
Last week, the market got some support from the US CPI as the data came mostly in line with expectations. In the following days though, we got some hottish data with the US PPI beating expectations by a big margin, the US Jobless Claims improving further and the inflation expectations in the UMich survey surprising to the upside.
The focus is now on Fed Chair Powell as he’s set to deliver his speech at the Jackson Hole Symposium tomorrow. Most likely, he won’t pre-commit to anything and just reiterate that they will decide based on the totality of the data. Nevertheless, traders will be on the lookout for any deviation from the baseline expectations.
In the bigger picture, gold should remain in an uptrend as real yields will likely continue to fall amid Fed easing. But hawkish repricing in interest rates expectations will likely keep on triggering corrections in the short term.
Gold Technical Analysis – Daily Timeframe
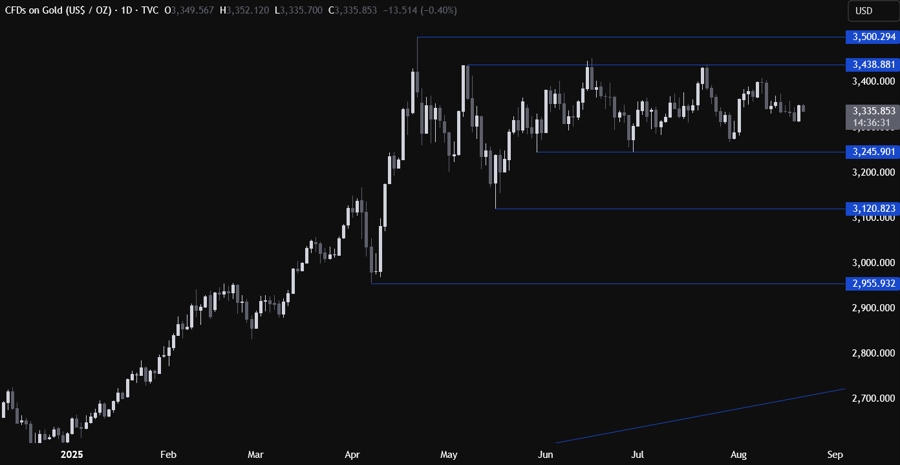
On the daily chart, we can see that gold continues to trade right in the middle of the range defined by the key 3,438 resistance and the 3,245 support. There’s not much else we can glean from this timeframe as market participants will likely continue to play the range until we get a breakout on either side. We need to zoom in to see some more details.
Gold Technical Analysis – 4 hour Timeframe
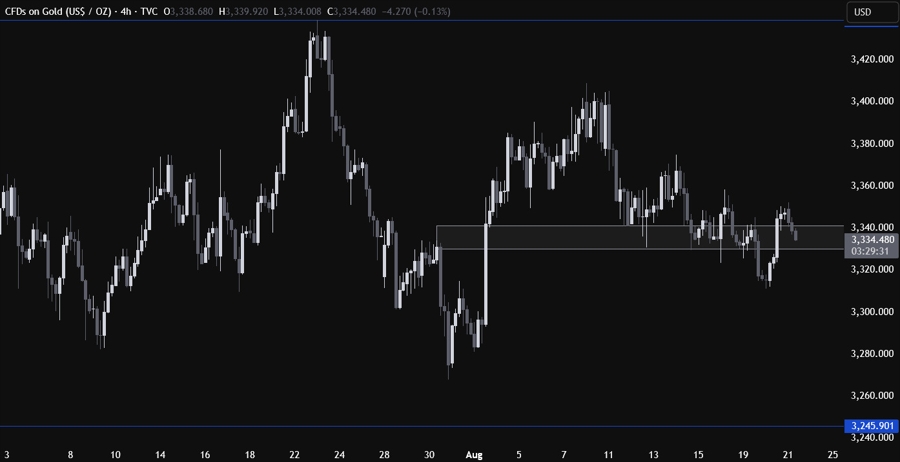
On the 4 hour chart, we can see that we have a minor support zone around the 3,330 level. The price probed lower recently but eventually it rallied back above the zone. The buyers will likely continue to step in around these levels with a defined risk below the support zone to position for a rally into the 3,438 resistance. The sellers, on the other hand, will want to see the price breaking lower again to pile in for a drop into the 3,245 level next.
Gold Technical Analysis – 1 hour Timeframe
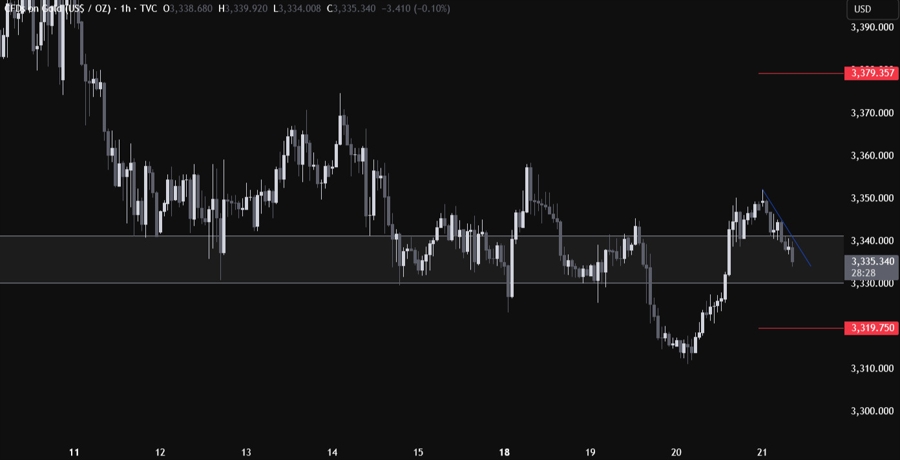
On the 1 hour chart, there’s not much else we can add here. On an intraday basis, we have a minor downward trendline defining the current bearish momentum. The sellers will likely continue to lean on the trendline to keep pushing into new lows, while the buyers will look for a break higher to increase the bullish bets into the 3,428 resistance. The red lines define the average daily range for today.
Upcoming Catalysts
Todaywe get the latest US Jobless Claims figures and the US Flash PMIs. Tomorrow, we conclude the week with Fed Chair Powell speech at the Jackson Hole Symposium.
 Copy Link
 Share on Facebook
 Share on X
 Share by Email
