
Gold Technical Analysis – Soft NFP triggers a dovish repricing
Fundamental Overview
Gold rallied strongly on Friday following a softer than expected NFP report. Overall, the data wasn’t as bad as one might think by just looking at the reaction but given that we were positioned for a strong report and the pricing got more hawkish after the Fed’s decision, the weaker data was enough to trigger a quick repricing.
In fact, the market is now pricing 59 bps of easing by year-end compared to just 35 bps before the NFP release. That’s a pretty quick change of heart. The attention will now switch to the next key data and the Fedspeak as we trade into the next FOMC decision in September.
It’s highly likely that more benign data will see Fed Chair Powell opening the door for a cut in September at the Jackson Hole Symposium. In the bigger picture, gold should remain in an uptrend as real yields will likely continue to fall amid Fed easing. But further hawkish repricing in interest rates expectations will likely keep on triggering corrections in the short term.
Gold Technical Analysis – Daily Timeframe
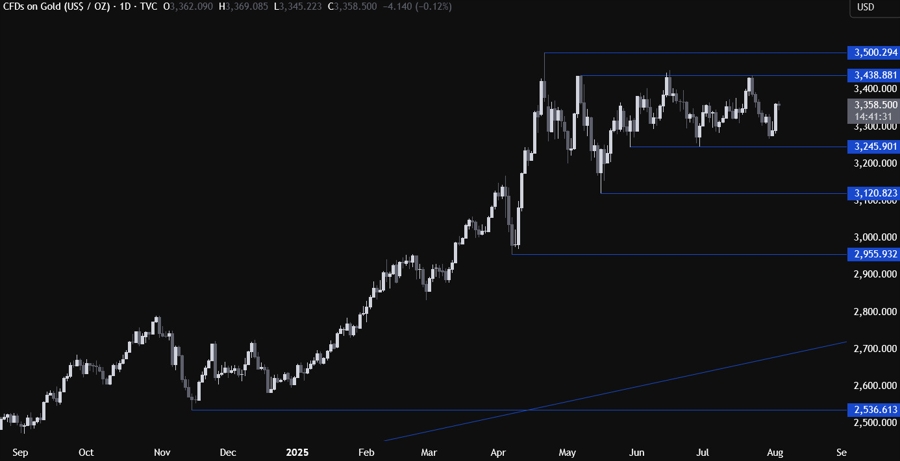
On the daily chart, we can see that gold bounced before reaching the 3,245 support as the soft US NFP report triggered a rally. The target for the buyers should be the key 3,438 resistance where we can expect the sellers to step in to position for a drop back into the support.
Gold Technical Analysis – 4 hour Timeframe
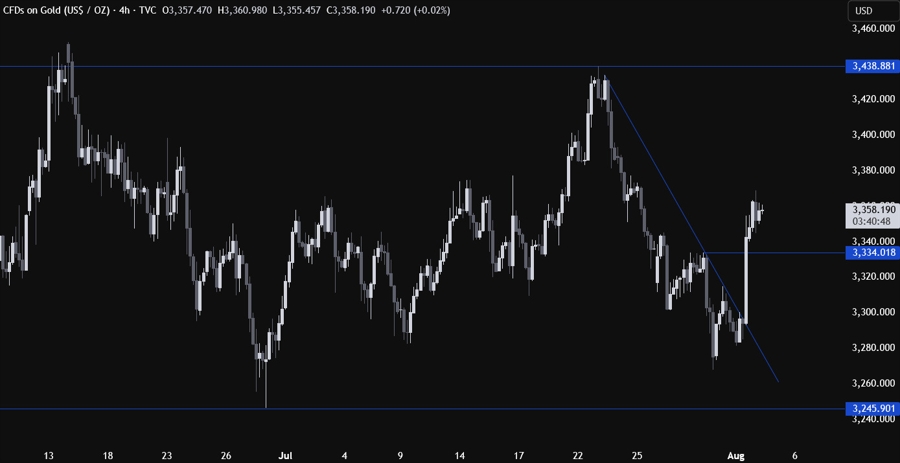
On the 4 hour chart, we can see that we had a downward trendline defining the bearish momentum. The price broke out to the upside and the buyers piled in more aggressively with the soft NFP data giving a boost. The price is now trading above the most recent swing high at 3,334 level that could act as support.
That’s where we can expect the buyers to step in with a defined risk below the level to keep pushing into the 3,438 resistance. The sellers, on the other hand, will look for a break lower to pile in for a drop back into the 3,245 support.
Gold Technical Analysis – 1 hour Timeframe
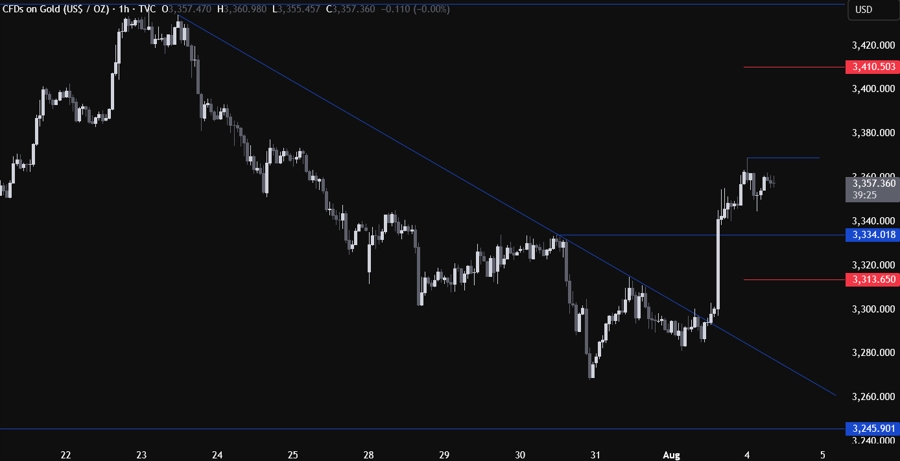
On the 1 hour chart, there’s not much else we can add here as the buyers will look for a bounce around the 3,334 level, while the sellers will target a break lower. If the bullish momentum remains strong today though, we could see the buyers increase the bullish bets on a break of the recent high at 3,369. The red lines define the average daily range for today.
Upcoming Catalysts
Tomorrow we have the US ISM Services PMI and on Thursday, we get the latest US Jobless Claims figures.
 Copy Link
 Share on Facebook
 Share on X
 Share by Email
