
Gold Technical Analysis – The focus turns to US labour market data
Fundamental Overview
Gold rallied strongly on Friday as Fed Chair Powell tilted more dovish by saying that “with policy in restrictive territory, the baseline outlook and the shifting balance of risks may warrant adjusting our policy stance.”
That saw traders firming up expectations for a rate cut in September and a total of two cuts by year-end. Now, the focus turns to the US NFP report next week which is going to be crucial and will influence greatly interest rates expectations.
Strong data might take the probability for a September cut towards a 50/50 chance but will certainly see a more hawkish repricing further down the curve and weigh on gold. Soft data, on the other hand, will likely see traders increasing the dovish bets with a third cut by year-end being priced in and giving gold a boost.
In the bigger picture, gold should remain in an uptrend as real yields will likely continue to fall amid Fed easing given their dovish reaction function. In the short-term though, hawkish repricing in interest rates expectations will likely keep on triggering corrections.
Gold Technical Analysis – Daily Timeframe
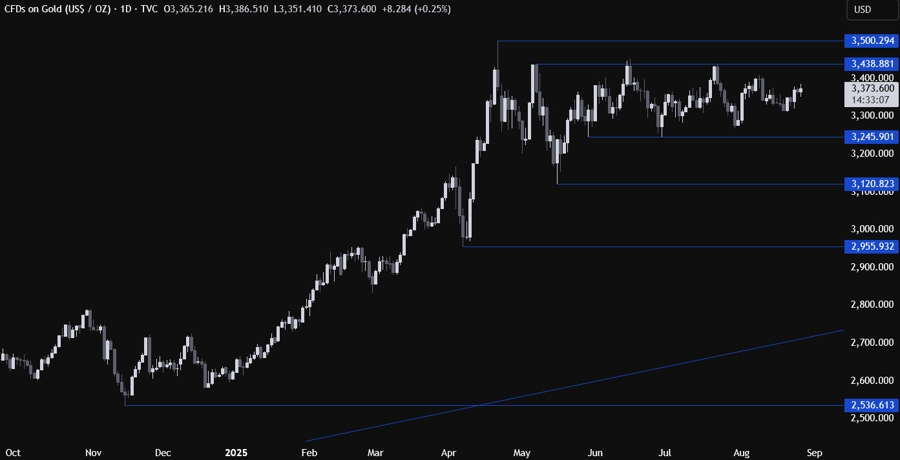
On the daily chart, we can see that gold continues to trade right in the middle of the range defined by the key 3,438 resistance and the 3,245 support. There’s not much else we can glean from this timeframe as market participants will likely continue to play the range until we get a breakout on either side. We need to zoom in to see some more details.
Gold Technical Analysis – 4 hour Timeframe
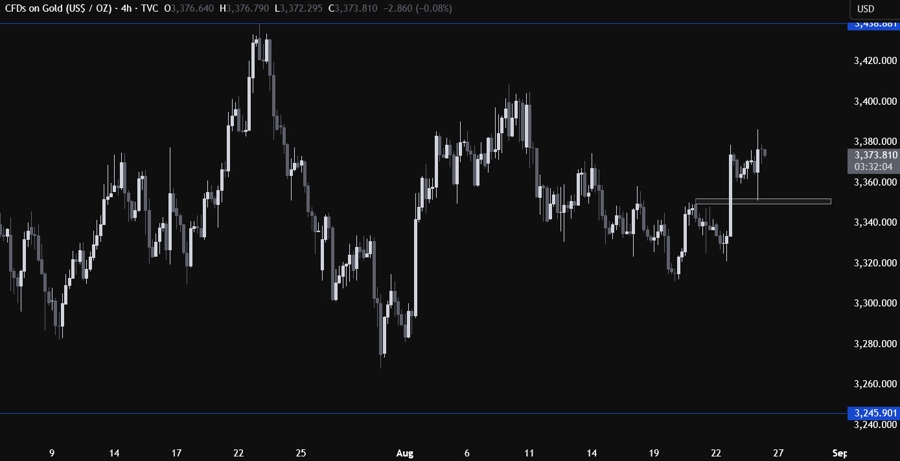
On the 4 hour chart, we can see that we got a rally on Friday and then a pullback yesterday into the most recent swing level at 3,350. The buyers stepped in around the swing level to position for further upside into the resistance. If we were to get another pullback, the buyers will likely pile in around the swing level again, while the sellers will look for a break lower to position for a drop into the 3,245 support next.
Gold Technical Analysis – 1 hour Timeframe
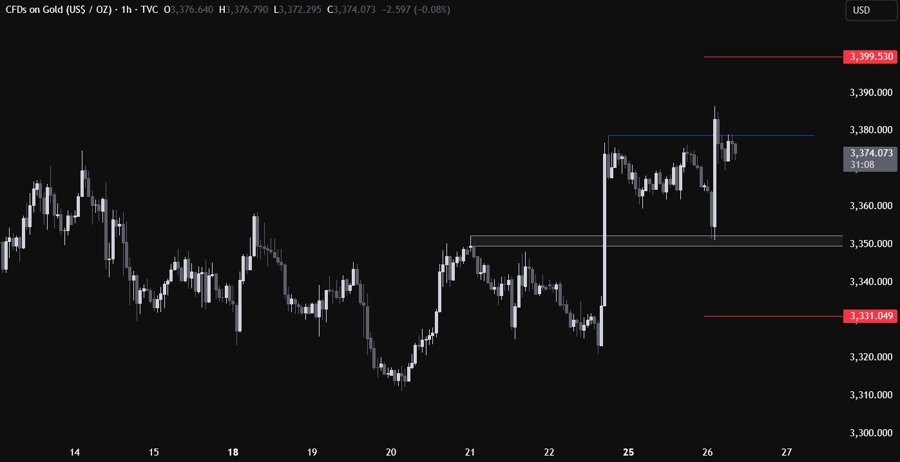
On the 1 hour chart, there’s not much else we can add here. On an intraday basis, we have a minor resistance around the 3,379 level. The buyers will want to see the price breaking higher to increase the bullish bets into the major resistance, while the sellers will likely pile in around these levels with a defined risk above the resistance to target the 3,350 swing level. The red lines define the average daily range for today.
Upcoming Catalysts
Today we have the US Consumer Confidence report. On Thursday, we get the latest US Jobless Claims figures. On Friday, we conclude the week with the US PCE price index.
 Copy Link
 Share on Facebook
 Share on X
 Share by Email
