
Gold Technical Analysis – The rangebound price action continues
Fundamental Overview
Gold remains stuck in a range as the market participants continue to look for strong reasons to trigger a breakout on either side. Right now, there’s still uncertainty around the interest rates outlook as a hot NFP in September could flip expectations pretty quickly.
The US CPI came mostly in line with expectations and given that we were already positioned for potentially hot figures, the market shrugged the data off. The market is still very certain on a September cut and has been even pricing slight chances of a 50 bps move. That’s of course too aggressive and could be punished if we get strong data before the next FOMC meeting.
In the bigger picture, gold should remain in an uptrend as real yields will likely continue to fall amid Fed easing. But hawkish repricing in interest rates expectations will likely keep on triggering corrections in the short term.
Gold Technical Analysis – Daily Timeframe
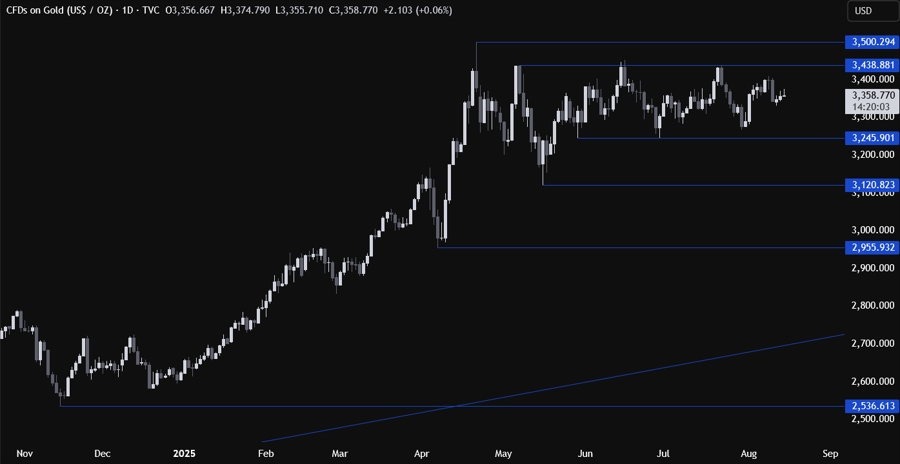
On the daily chart, we can see that gold is trading right in the middle of the range defined by the key 3,438 resistance and the 3,245 support. There’s not much else we can glean from this timeframe as market participants will likely continue to play the range until we get a breakout on either side. We need to zoom in to see some more details.
Gold Technical Analysis – 4 hour Timeframe
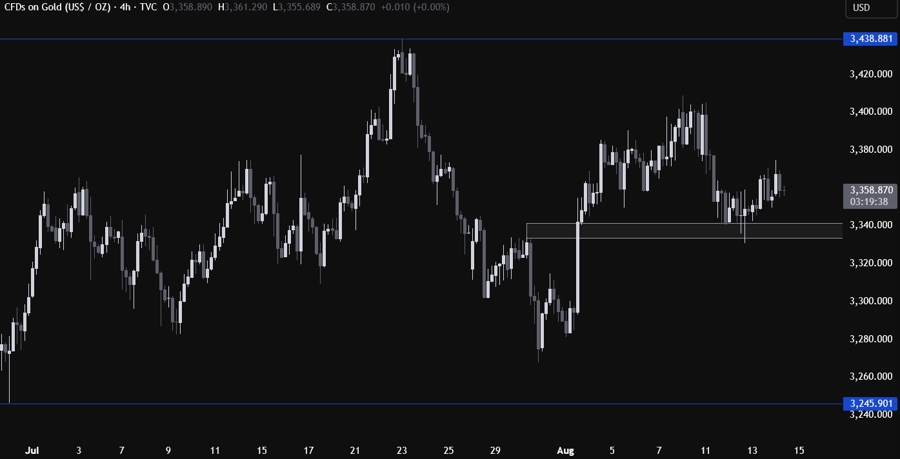
On the 4 hour chart, we can see that we have a minor support zone around the 3,330 level. That’s where the buyers stepped in with a defined risk below the support to position for a rally back into the 3,438 resistance. Late buyers will want to see another pullback into the support to position for a rally. The sellers, on the other hand, will look for a break lower to pile in for a drop into the 3,245 support next.
Gold Technical Analysis – 1 hour Timeframe
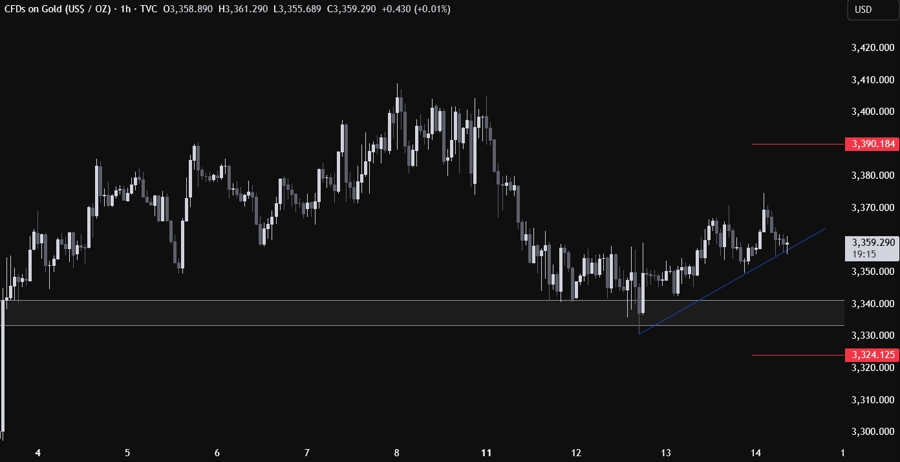
On the 1 hour chart, we can see that we have a minor upward trendline defining the bullish momentum on this timeframe. The buyers will likely continue to lean on the trendline to keep pushing into new highs, while the sellers will look for a break lower to pile in and target a break below the minor support zone. The red lines define the average daily range for today.
Upcoming Catalysts
Today we get the US PPI and the US Jobless Claims figures. Tomorrow, we conclude the week with the US Retail Sales and the University of Michigan Consumer Sentiment report.
 Copy Link
 Share on Facebook
 Share on X
 Share by Email
