
Gold Technical Analysis – All eyes on the US labour market data
Fundamental Overview
Gold continued to edge higher this week following Powell’s dovish tilt last Friday. Inflation expectations kept on climbing, while Treasury yields have not gone anywhere. That caused real yields to fall giving further support to gold prices.
The focus is now on the US labour market data that will culminate with the NFP report next Friday. Strong data might take the probability for a September cut towards a 50/50 chance but will certainly see a more hawkish repricing further down the curve and weigh on gold.
Soft data, on the other hand, will likely see traders increasing the dovish bets with a third cut by year-end being priced in and giving gold another boost.
In the bigger picture, gold should remain in an uptrend as real yields will likely continue to fall amid Fed easing given their dovish reaction function. In the short-term though, hawkish repricing in interest rates expectations will likely keep on triggering corrections.
Gold Technical Analysis – Daily Timeframe
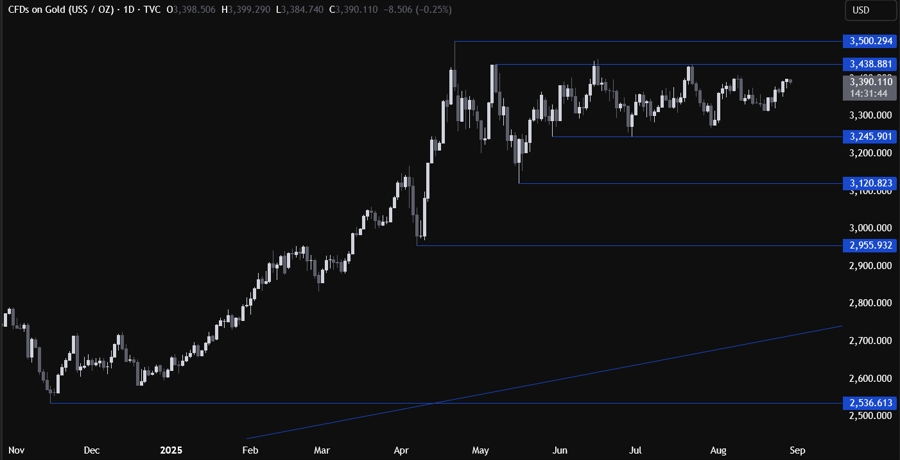
On the daily chart, we can see that gold has been slowly climbing towards the key 3,438 resistance. If the price gets there, we can expect the sellers to step in with a defined risk above the resistance to position for a drop back into the 3,245 support. The buyers, on the other hand, will want to see the price breaking higher to extend the rally into the 3,500 level next.
Gold Technical Analysis – 4 hour Timeframe
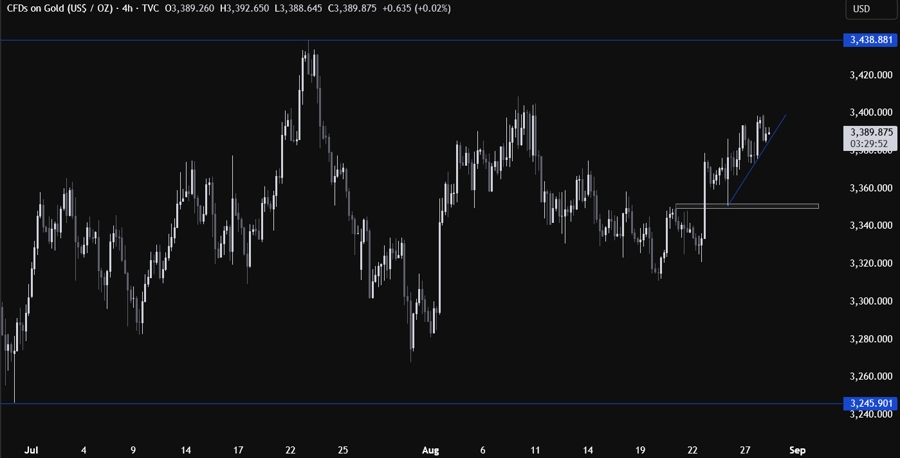
On the 4 hour chart, we can see that we have a minor upward trendline defining the bullish momentum on this timeframe. The buyers will likely continue to lean on the trendline with a defined risk below it to keep pushing into new highs, while the sellers will look for a break lower to target a pullback into the 3,350 level next.
Gold Technical Analysis – 1 hour Timeframe
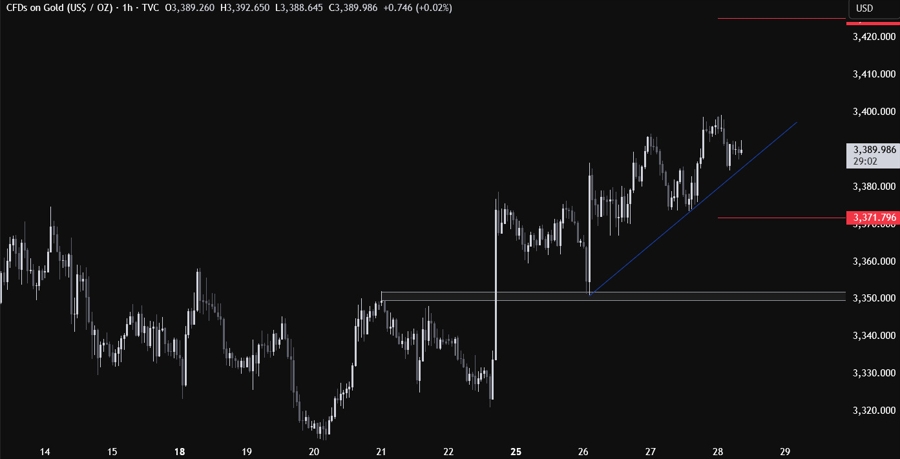
On the 1 hour chart, there’s not much else we can add here as the buyers will continue to pile in around these levels, while the sellers will look for a break below the trendline to position for a drop into the 3,350 level. The red lines define the average daily range for today.
Upcoming Catalysts
Today we get the latest US Jobless Claims figures, while tomorrow we conclude the week with the US PCE price index.
 Copy Link
 Share on Facebook
 Share on X
 Share by Email
