
Crude Oil Technical Analysis – The market awaits new catalysts
Fundamental Overview
The crude oil market went into a dormant state ever since the end of the Israel-Iran conflict. We haven’t got much in terms of new information since then which kept the price action rangebound.
The tariffs trade should now be near the peak as pretty much everything is priced in and everyone knows we’ll either get further deadlines or deals within the 10-20% tariff range.
The OPEC+ increases in supply have also ceased to influence prices as the market priced that in and we are approaching the end of their output hikes.
This leaves us with economic data and the Fed as potentially the next major drivers of asset prices for the rest of the year. The growth and inflation picture should remain skewed to the upside for now as the Fed forward guidance remains tilted towards easing. That should keep the market supported.
Crude Oil Technical Analysis – Daily Timeframe
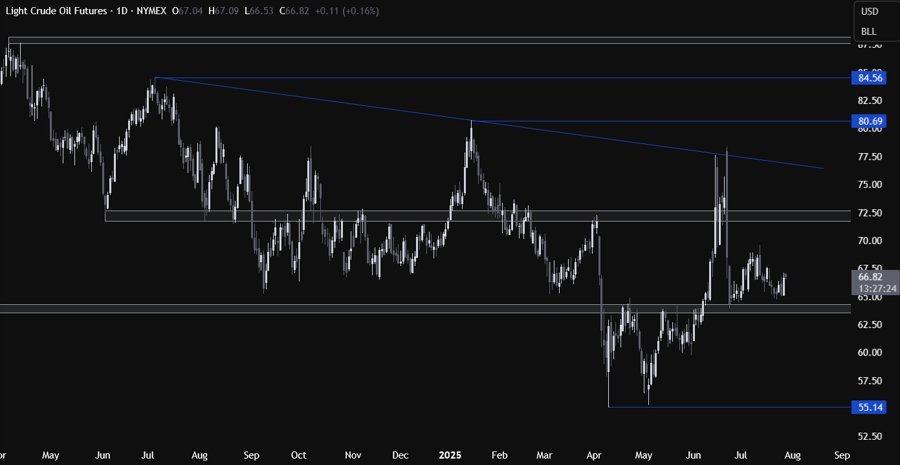
On the daily chart, we can see that crude oil continues to bounce from the key support zone around the 64.00 handle. The buyers keep on stepping in around the support with a defined risk below it to target a move back into the 72.00 resistance. The sellers will need a break below the key support to open the door for a drop into the 55.00 handle next.
Crude Oil Technical Analysis – 4 hour Timeframe
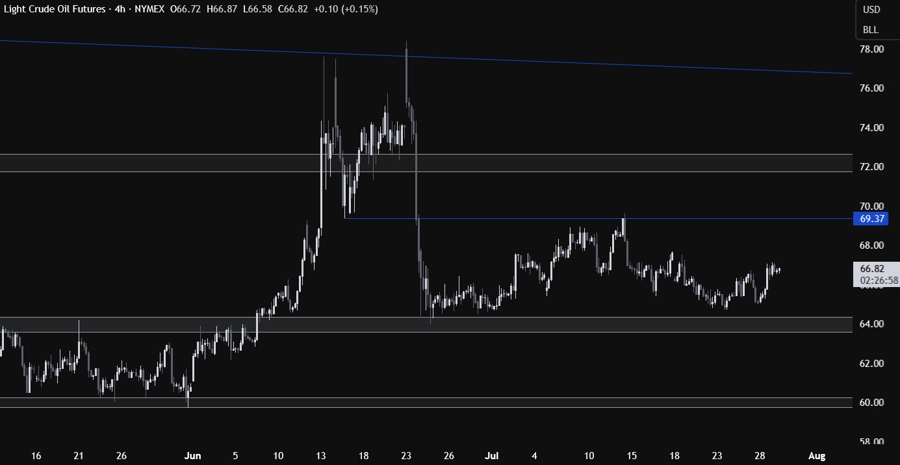
On the 4 hour chart, we can see that we have a range now between the 64.00 support and the 69.00 resistance. The market participants will likely continue to play the range by buying at support and selling at resistance until we get a breakout on either side.
Crude Oil Technical Analysis – 1 hour Timeframe

On the 1 hour chart, we can see that the recent price action has been pretty messy. This is what generally happens in rangebound environments and what kills most traders as they give the profits back to the market. We have a few levels here like the resistance at 67.68 and the trendline around the 65.50 level. Traders will likely lean on those levels but from a risk management perspective, it would be better to step in around the key support or better yet, wait for a clear bullish catalyst. The red lines define the average daily range for today.
Upcoming Catalysts
Today we have the US Job Openings and Consumer Confidence data. Tomorrow, we have the US ADP, the US Q2 GDP and the FOMC rate decision. On Thursday, we get the US PCE price index, the US Jobless Claims and the US Employment Cost Index. Finally, on Friday, we conclude the week with the US NFP report and the US ISM Manufacturing PMI.
 Copy Link
 Share on Facebook
 Share on X
 Share by Email
