
EUR/USD Price Forecast: Rises to near 1.1550, four-year highs
- EUR/USD may revisit the four-year high at 1.1573.
- The 14-day RSI remains above 70, indicating overbought conditions and hinting at a potential downward correction.
- Immediate support is seen near the lower boundary of the ascending channel, around 1.1400.
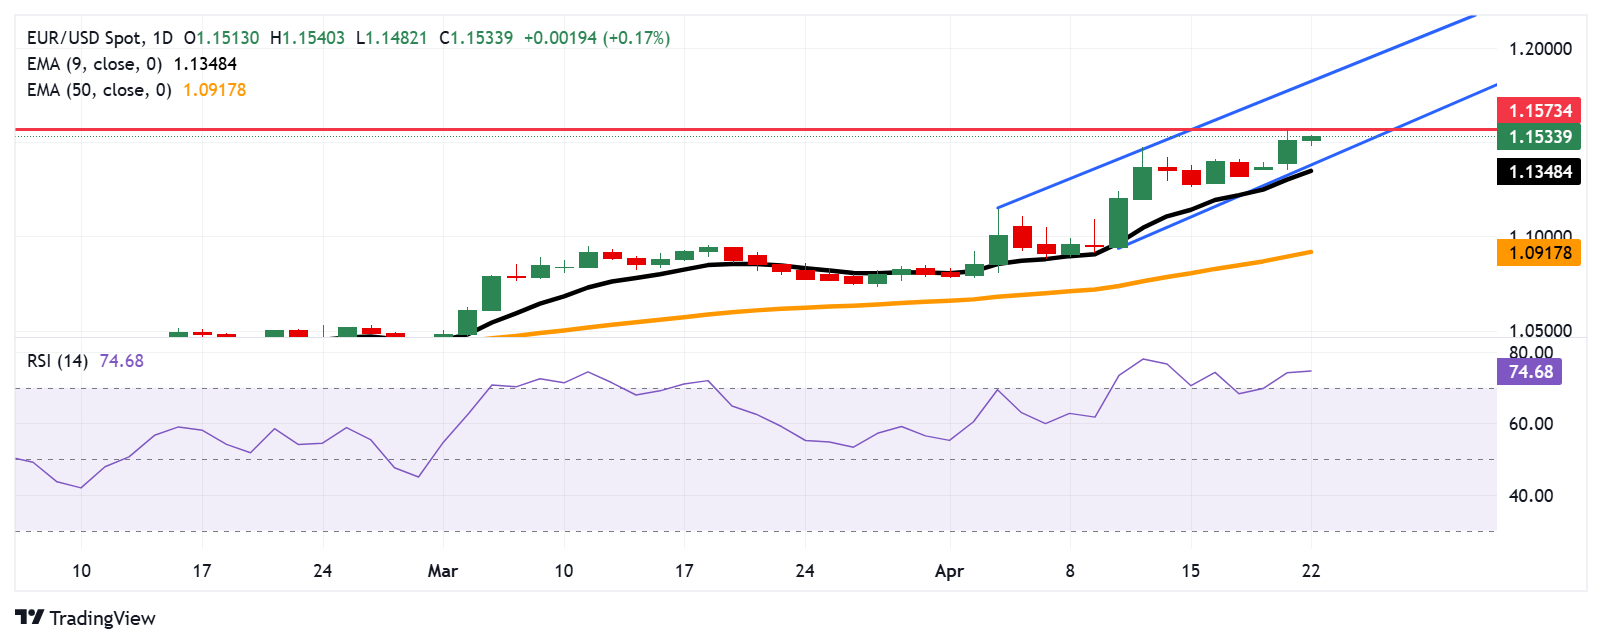
EUR/USD extends its gains for the third successive session, trading around 1.1530 during the Asian hours on Tuesday. The technical analysis of the daily chart suggests growing buying pressure and as the pair is moving upwards within an ascending channel pattern.
Furthermore, the EUR/USD pair remains above the nine-day Exponential Moving Average (EMA), signalling strengthened short-term price momentum. However, the 14-day Relative Strength Index (RSI), a key momentum indicator, remains above the 70 mark, suggesting that the pair is overbought and a downward correction is on the horizon.
On the upside, the EUR/USD pair could retest the 1.1573, the highest since November 2021, which was recorded on April 21. A break above this level could reinforce the bullish bias and lead the pair to explore the region around the ascending channel’s upper boundary at the 1.1830 level.
The EUR/USD pair could test immediate support around the lower boundary of the ascending channel at 1.1400, followed by the nine-day EMA at the 1.1348 level. A break below this crucial support zone could weaken the bullish bias and put pressure on the pair to navigate the region around the 50-day EMA at the 1.0917 level.
EUR/USD: Daily Chart
Euro PRICE Today
The table below shows the percentage change of Euro (EUR) against listed major currencies today. Euro was the strongest against the US Dollar.
| USD | EUR | GBP | JPY | CAD | AUD | NZD | CHF | |
|---|---|---|---|---|---|---|---|---|
| USD | -0.22% | -0.21% | -0.52% | -0.27% | -0.29% | -0.27% | -0.17% | |
| EUR | 0.22% | 0.00% | -0.36% | -0.08% | -0.13% | -0.07% | 0.03% | |
| GBP | 0.21% | -0.00% | -0.34% | -0.09% | -0.12% | -0.07% | 0.03% | |
| JPY | 0.52% | 0.36% | 0.34% | 0.27% | 0.23% | 0.34% | 0.41% | |
| CAD | 0.27% | 0.08% | 0.09% | -0.27% | -0.04% | -0.01% | 0.08% | |
| AUD | 0.29% | 0.13% | 0.12% | -0.23% | 0.04% | 0.04% | 0.14% | |
| NZD | 0.27% | 0.07% | 0.07% | -0.34% | 0.00% | -0.04% | 0.11% | |
| CHF | 0.17% | -0.03% | -0.03% | -0.41% | -0.08% | -0.14% | -0.11% |
The heat map shows percentage changes of major currencies against each other. The base currency is picked from the left column, while the quote currency is picked from the top row. For example, if you pick the Euro from the left column and move along the horizontal line to the US Dollar, the percentage change displayed in the box will represent EUR (base)/USD (quote).
 Copy Link
 Share on Facebook
 Share on X
 Share by Email
