
GBP/USD Price Analysis: Bulls pause ahead of key fundamental drivers
- GBP/USD dips 0.16% to 1.2605 on Tuesday after reaching its highest level since mid-January.
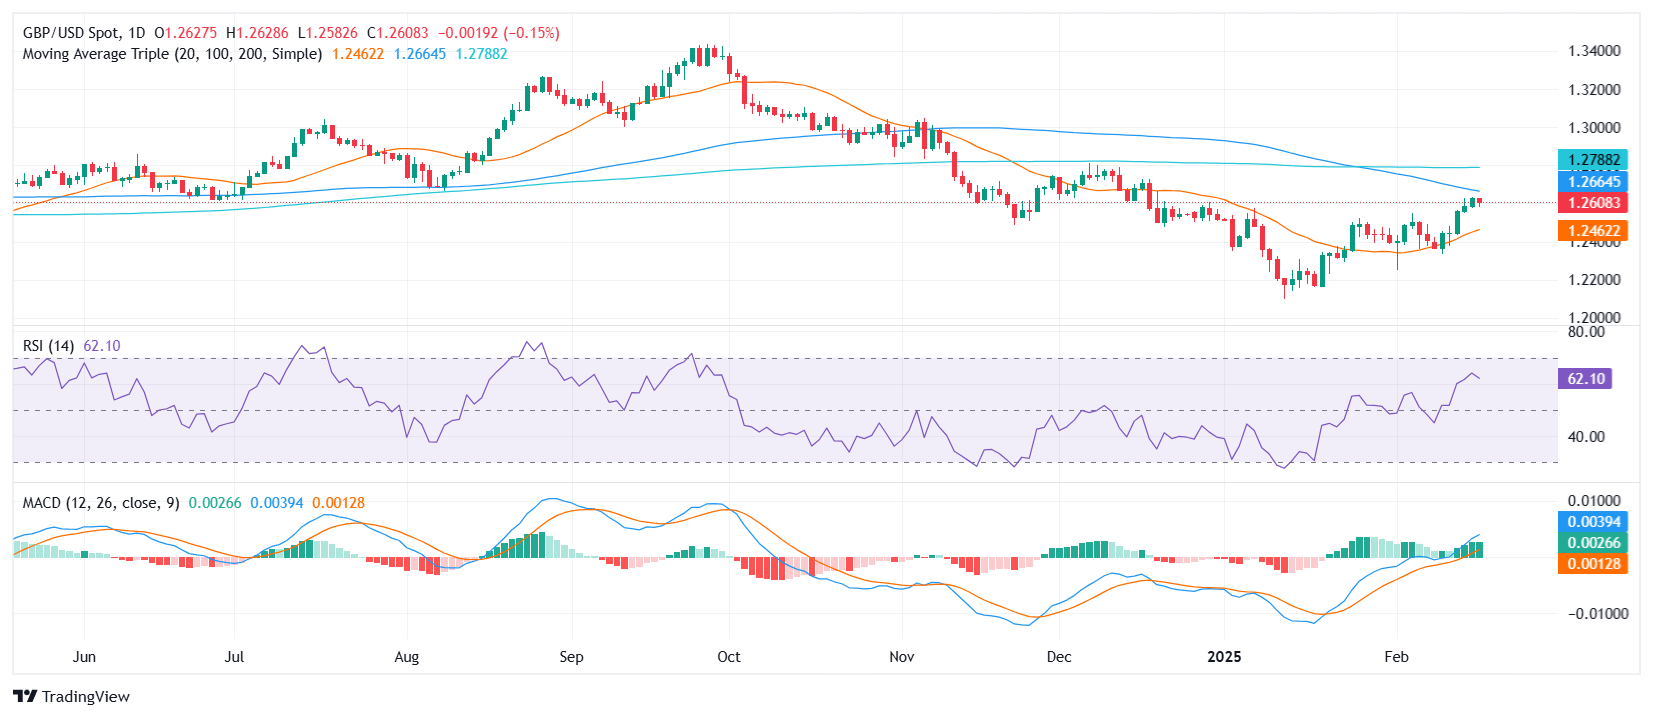
- RSI declines to 62, indicating a slowdown in bullish momentum, while MACD remains flat with green bars.
- The pair eyes the 100-day SMA at 1.2660, with UK inflation and Retail Sales data set to provide direction.
GBP/USD retreated slightly on Tuesday, edging down 0.16% to 1.2605 after an extended rally that propelled it to its highest level since mid-January. Despite this mild pullback, the broader outlook remains constructive, as the pair continues to set its sights on the 100-day Simple Moving Average (SMA) at 1.2660.
Momentum indicators suggest a temporary cooling-off period rather than a structural shift. The Relative Strength Index (RSI) has dipped to 62, signaling a slowdown in buying pressure but still holding in positive territory. Meanwhile, the Moving Average Convergence Divergence (MACD) histogram remains flat with green bars, reinforcing the notion that the latest price action is more of a technical correction than a bearish reversal.
Looking ahead, GBP/USD could receive fresh volatility on Wednesday as the UK is set to release key economic data, including inflation figures and retail sales numbers. These reports will be crucial in shaping expectations for Bank of England policy and could provide the fundamental push needed for the pair to either resume its upward trajectory or extend its consolidation phase.
GBP/USD daily chart
 Copy Link
 Share on Facebook
 Share on X
 Share by Email
